Retirement Income Series: Find The Best Covered Call Option Using Marketxls

Meet The Ultimate Excel Solution for Investors
- Live Streaming Prices Prices in your Excel
- All historical (intraday) data in your Excel
- Real time option greeks and analytics in your Excel
- Leading data in Excel service for Investment Managers, RIAs, Asset Managers, Financial Analysts, and Individual Investors.
- Easy to use with formulas and pre-made sheets
Background
I like to sell covered calls against many of my stock positions. It’s a safe and easy way to boost the income I receive. As a retired person who does not yet receive social security, and does not have a pension, income from investments is very important to me!
Today’s Income Challenge
Today I was looking at my Apple (AAPL) shares. My call on those shares expired last week so I’m looking to sell a new call today. I bought my 100 shares on 9/11/20 at $117.70. Today’s price is $126.88. I would like to keep them but, when I sell a call, there is some risk the shares could be called away. So I want to set my strike price higher than I think the shares will rise. If they do get called, at least it will be at a price I’m comfortable with.
Note: when I sell a covered call against my shares, I am being paid to take on a contractual obligation. I choose the strike price and expiry date, and receive a premium, which is paid in cash into my account. The contract says that the option buyer can buy my shares at the strike price any time between now and the expiry date. In practice, the option buyer would most likely exercise this right only if the share price exceeded the strike price at expiry.
Back to AAPL. Based on my observation of recent share price movements, I would like to set a strike price between $135 and $145 because I don’t think the shares will rise above that in the next few months. It’s been range-bound between $115 and $135 for almost 6 months, and I’m not aware of any major catalyst which will boost the price much above that in the near future. But which specific contract will give me the best return?
And I am looking at expiration dates between 52 and 388 days into the future.
Tackling the Challenge
I can view the option table in my broker (Fidelity) software and do the calculations, one by one.
Or I can use MarketXLS to download the option chain into Excel and get exact returns in a format that makes it easy to compare. Let’s take a look.
Here’s the AAPL option chain from Fidelity, filtered to show the strikes and expiries of interest. Note that the call options are on the left-hand side.

At this point, my task is to find the row that gives me the best annualized return, and also has a strike price that makes it unlikely for the shares to be called away.
I can do each calculation. Like on the first row, using the last price: I would receive $149 in premium for a 52-day holding period. Based on my acquisition price: $149 / $11,700 = 1.27% absolute return. Since this return is over a 52-day period, I will annualize it to make comparisons to other expiry dates easier: (0.84% / 52) * 365 = 8.90% annualized return. Not terrible for a call on a stock that is also paying a small dividend. But can I do better? I could do these 2 calculations 21 times and get the answer for each row, but why don’t I let MarketXLS do most of the work for me? Good idea!
MarketXLS Can Help
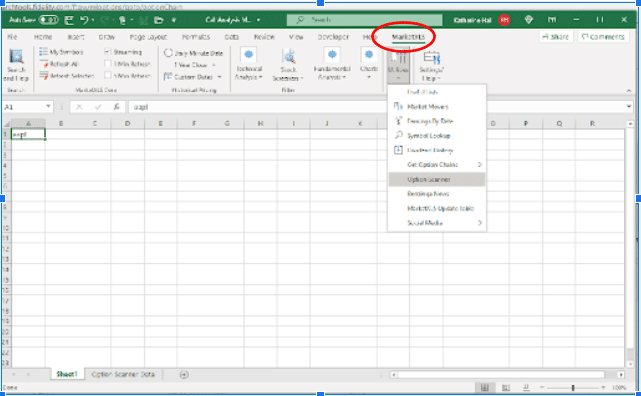
Here’s how to do it: open an excel workbook, type in the ticker and select that cell, and navigate to the MarketXLS section on the ribbon. Click on Utilities and select Option Scanner from the dropdown menu.
In about 2 seconds, this screen appears.

I’m going to filter the list a little bit. I will choose Calls in the Calls or Puts dropdown. And I will click on the Edit Filter button (bottom right) to set the strike price range from $135 to $145.

And then I’ll click Send these to Excel. That part will take about 90 seconds, so I’m gonna go refill my coffee.
OK. Back now. And here are the results which populated a new tab on the same spreadsheet.
The Analysis
It resulted 94 rows (I didn’t filter on expiration dates) and here is what the first few rows look like.

To do a proper analysis, I need to add 3 columns, and then enter some simple Excel formulas:
- Days to expiry: (expiry date minus today)
- Return: last price* divided by my acquisition cost per share of $117.70
- Annualized Return (value in the Return column divided by # of days to expiry) * 365
*Some may prefer to use the bid or ask price rather than the last price for the option. Bid and ask prices can be pulled into your spreadsheet easily; but the last price is automatically there, so I’ll just use that one.
Here’s what it looks like with those columns added, and I went ahead and sorted by annualized return (largest to smallest) because that is the next step:

As expected, the best annualized returns are for the $135 strike price. That strike is closest to current price and thus more likely to be exceeded; so the option buyers are willing to pay more premium for that likelihood. Now that I think about it, I’m much more comfortable with a $140 strike price, so let’s find the first time $140 appears in the strike column.
Chaching! It looks like the 19Nov$140 contract pays a very acceptable 8.38% annualized return. But, that expiry date is 6 months away and a lot can happen to impact the share price in that length of time. So let’s look at ones with fewer days to expiry.
Continuing to scan down the list, the 15Oct and 17Sept expiries pay 7.81% and 7.39% annualized returns, respectively. For covered calls, I average about 5.9%, so getting more than 7% is definitely OK with me. I think I’ll sell the 15Oct$140 call for about $360 premium.

After the Trade
I will monitor this option position carefully and look for opportunities to buy it back early and cheaply. Or, if it gets in trouble (share price creeps above $140), I might roll it (buy back this option and sell another one for a higher strike, further into the future, for a net credit on premium). Or I can just let the shares go and be happy enough with my profit. This is the reason I really love selling options…I can create income in a variety of market conditions, with very little risk. Yay!
But there are some risks with this strategy. One risk occurs if the share price declines substantially before the expiration. If you had not sold the call, you might be inclined to sell your shares before price declines further; but you are contractually obligated to hold the shares thru expiry. You could buy back the call, but this is often expensive. The other significant risk occurs if the share price shoots up like a rocket. For example, if AAPL price increases to $160 or so, I am still obligated to sell at $140. I’ve capped my potential profit. But, in general those risks are manageable and are minimized if you select the correct strike price.
PS – once you go through this process the first time, you can save your spreadsheet. The next time you want to find the best covered call, paste the MarketXLS results into the first 15 columns of your “template”, click Refresh All on the MarketXLS ribbon, and let the formulas in the last 3 columns do their work automatically. No need to add them every time. Turn on your filters, sort, and voila! You will be on your way to making great decisions when you sell covered calls.
Disclaimer
None of the content published on marketxls.com constitutes a recommendation that any particular security, portfolio of securities, transaction, or investment strategy is suitable for any specific person.
The author is not offering any professional advice of any kind. The reader should consult a professional financial advisor to determine their suitability for any strategies discussed herein.
The article is written to help users collect the required information from various sources deemed to be an authority in their content. The trademarks, if any, are the property of their owners, and no representations are made. All trademarks referenced are the property of their respective owners. Other trademarks and trade names may be used in this document to refer to either the entity claiming the marks and names or their products. MarketXLS disclaims any proprietary interest in trademarks and trade names other than its own or affiliation with the trademark owner.
Get Market data in Excel easy to use formulas
- Real-time Live Streaming Option Prices & Greeks in your Excel
- Historical (intraday) Options data in your Excel
- All US Stocks and Index options are included
- Real-time Option Order Flow
- Real-time prices and data on underlying stocks and indices
- Works on Windows, MAC or even online
- Implement MarketXLS formulas in your Excel sheets and make them come alive
- Save hours of time, streamline your option trading workflows
- Easy to use with formulas and pre-made templates

I invite you to book a demo with me or my team to save time, enhance your investment research, and streamline your workflows.