Short Call Synthetic Straddle Options Strategy (Using MarketXLS Template)
")
Meet The Ultimate Excel Solution for Investors
- Live Streaming Prices Prices in your Excel
- All historical (intraday) data in your Excel
- Real time option greeks and analytics in your Excel
- Leading data in Excel service for Investment Managers, RIAs, Asset Managers, Financial Analysts, and Individual Investors.
- Easy to use with formulas and pre-made sheets
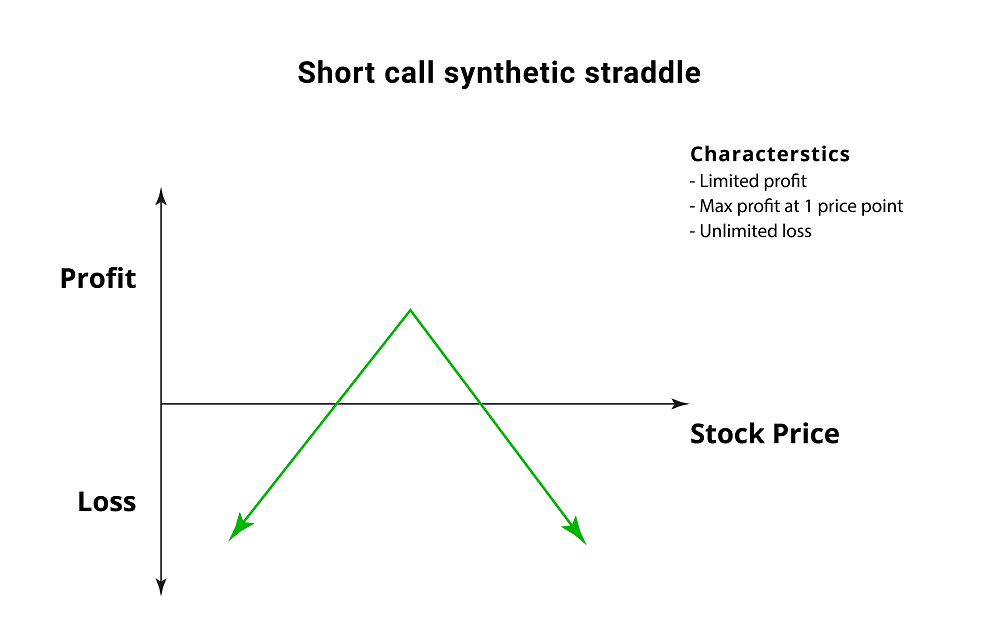
Short Call Synthetic Straddle is an unlimited risk, limited profit options trading strategy that is used when the options trader assumes that the underlying asset price will undergo very little volatility in the near period. The trader must hold strong views of the stability in the market.
This strategy is implemented by buying the underlying stock and selling enough at-the-money calls to cover twice the number of shares bought.
The trader who implements a short call synthetic straddle expects little to no volatility in the price of the underlying asset. When that actually happens, the trader stands a greater chance of making a profit. Since the shape of the payoff profile is an inverted “V” shape, the maximum profit occurs at only 1 price point, that is, the strike price of the calls.
Short Call Synthetic Straddle Construction
- Long 100 shares
- Sell 2 ATM Calls
To execute the Short Call Synthetic Straddle strategy, you need to sell twice as many At The Money (ATM) call options as you have Long stocks. For example, for every 100 shares bought, 2 call contracts must be sold.
Profit Potential
The maximum profit for this strategy is limited in nature. Maximum profit from the Short Call Synthetic Straddle can be made when the underlying asset price is trading at the strike price of the options sold on the expiration date. At this price, both the sold call options expire worthless and the options trader keeps the entire net premium received as profit.
The formula for calculating maximum profit is:
- Maximum Profit is achieved when Strike Price of Short Call = Price of Underlying
- Max Profit = Net Premium Received – Commissions Paid
- Maximum Profit = Limited
Unlimited Loss
Large losses for the Short Call Synthetic Straddle could be withstood when the underlying asset price makes a strong move either upwards or downwards at expiration. A strong downward move will cause the long stock position to suffer a big loss while a strong upward move causes the short calls to expire deep in the money.
The formula for calculating loss is:
- Loss = Purchase Price of Underlying – Price of Underlying – Net Premium Received (or)
- Price of Underlying – Strike Price of Short Call – Net Premium Received
- Loss occurs when Price of Underlying at expiry < Purchase Price of Underlying – Net Premium Received or Price of Underlying > Strike Price of Short Call + Net Premium Received
- Maximum Loss = Unlimited
Breakeven Points
The Short Call Synthetic Straddle position has 2 break-even points:
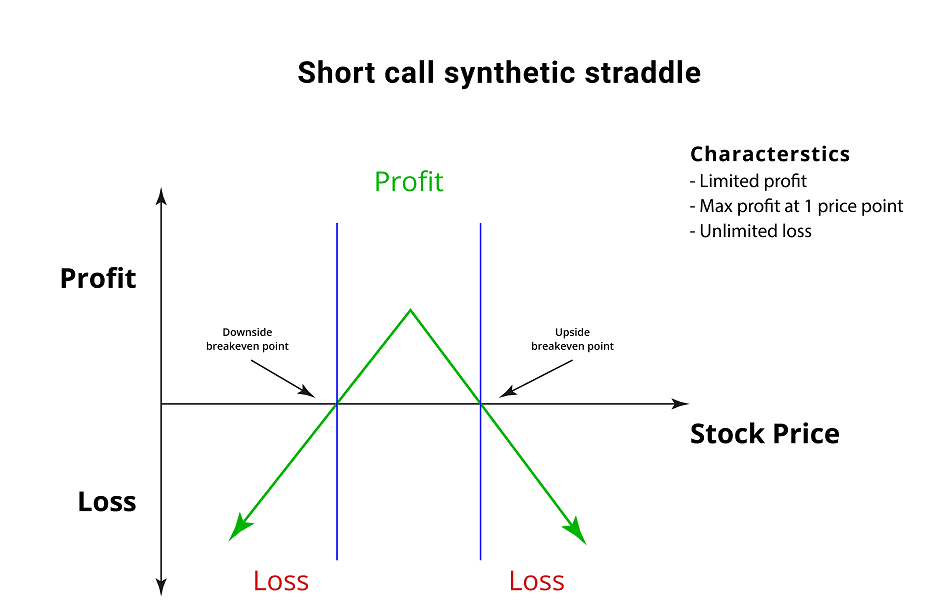
- Upper Breakeven Point = Strike Price of Short Call + Net Premium credited
- Lower Breakeven Point = Purchase Price of Underlying – Net Premium credited
After the break-even points are calculated, the trader is able to understand where the loss-making and profit-making zones are.
Applying Short Call Synthetic Straddle Strategy Using MarketXLS Template With an Example:
MarketXLS software is a one-stop solution for the analysis of your entire investments. It provides a host of functions like eps, various ratios, key fundamentals, historical data, options pricing and much more to assess the value of your investments. It provides a variety of templates for various options trading strategies and also to compare your portfolio stocks for doing a better analysis of your investments.
Step 1: Enter the stock ticker in cell D6 and press enter. The template will provide the upcoming expiry dates for the stock and the current market price. Select any one of the expiry dates. Note that the template uses the DD-MM-YYYY date format.
Step 2: Enter the ATM strike price for Call options sold in cell D12 and enter the price for stock’s long position in cell E15. Also mention the number of stocks bought in cell E16. The template will calculate the breakeven points for you.
Link to the template: https://marketxls.com/template/synthetic-short-straddle-with-calls/
Step 3: Enter the number of Call options sold in cell G19.
Step 4: The template might ask you to refresh. Go to the MarketXLS tab in the ribbon > Refresh All. Click on Refresh All.
The template uses the bid price for sells and ask price for buys and related premiums to calculate the net cash flow for you.
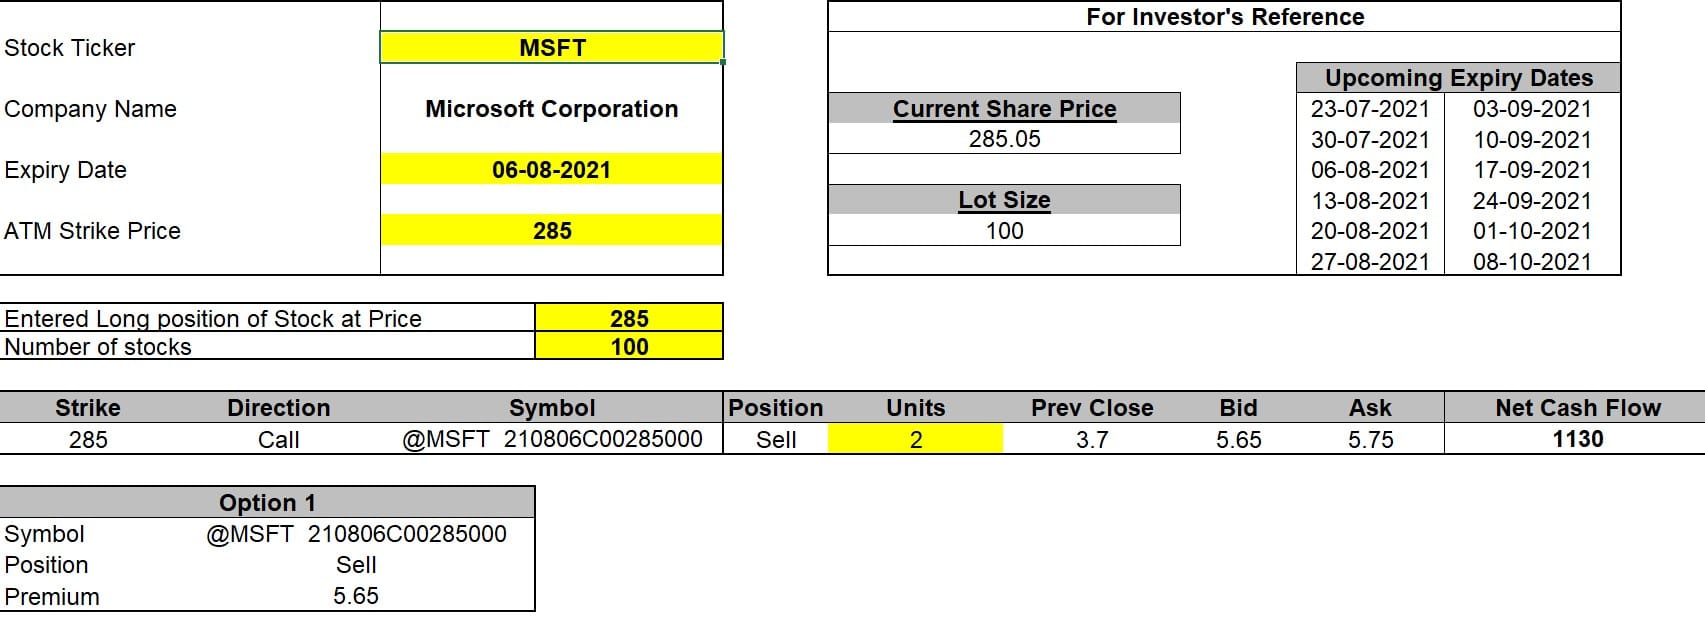
Microsoft Corporation (MSFT) as an example in the above template:
MSFT stock is trading at levels of $285 on 22nd July 2021. I have selected the upcoming expiry of August 6, 2021 to enter the trade. I want to execute the Short Call Synthetic Straddle strategy at this price because I feel the stock will not experience any major volatility in the coming 2 weeks. So I have bought 100 shares @$285 and also sold two Call Options at the same strike price of $285.
The template will calculate the premium amount for the options exercised and thus calculate the net cash flow for entering the trade, which is $1130 credit in this case.
[ 5.65*100*2 (2 Call Options at $285 strike) = +$1130 ]
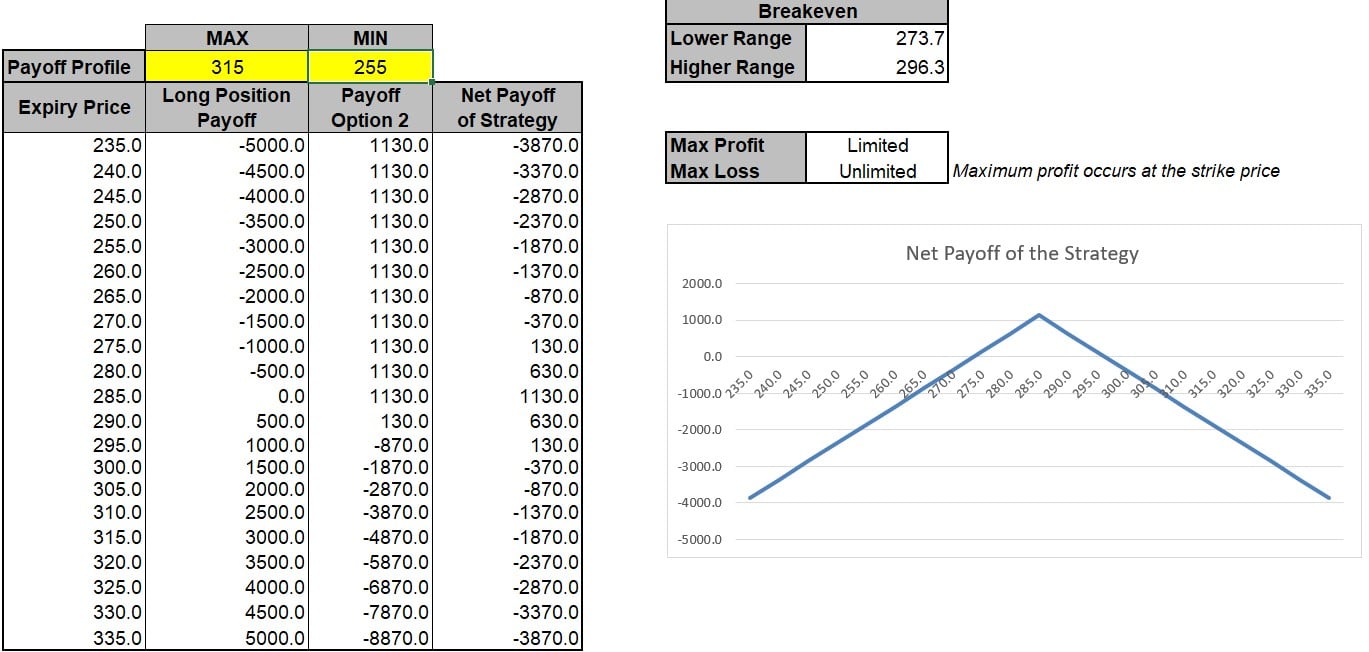
Suppose if the stock trades at $265 on the expiration date (against my expectation), the two Call Options expire worthless but the long stock position suffers a loss of $2000. Taking into account the initial $1130 cash flow received, my net loss would be $870. This loss could be greater if the stock price falls any further.
Now, if the stock trades at $305 on the expiration date (against my expectation), the two Call Options expire in the money and have an intrinsic value of $4000 together. However, the long stock position will gain $2000. Taking into account the initial $1130 cash flow received, my net loss would be $2000+$1130-$4000= -$870. This loss could be greater if the stock price rises any further.
If the stock keeps trading at the strike price of $285, both the Call Options expire worthless while the long stock position will break even. Hence, the Short Call Synthetic Straddle will give me the maximum profit which is equal to the initial $1130 net premium received upon entering the trade.
Here is a video explaining the Short Call Synthetic Straddle Strategy using MarketXLS:
Bottom Line
With the execution of this strategy, the trader can immediately transform a long stock position into an options trading position which profits when the position remains steady. At the same time, if a trader is in a neutral market situation, then Short Call Synthetic Straddle is one of the options one can implement.
There is a high amount of risk involved as well, thus, you have to be very sure about the point where the market will experience no volatility. Otherwise, stakes can be quite high.
For ease of understanding, the calculations carried out in the above example did not take into account commission charges as they are relatively small amounts and vary across brokerage houses.
However, for active traders, commissions can impact the portion of their profits in the long run. If you trade options regularly, it is advisable to look for a low commissions broker.
If you want to learn about Short Synthetic Straddle with Puts Strategy or other options strategies, visit https://marketxls.com/blog/
Disclaimer
All trademarks referenced are the property of their respective owners. Other trademarks and trade names may be used in this document to refer to either the entity claiming the marks and names or their products. MarketXLS disclaims any proprietary interest in trademarks and trade names other than its own, or affiliation with the trademark owners.
None of the content published on marketxls.com constitutes a recommendation that any particular security, portfolio of securities, transaction, or investment strategy is suitable for any specific person. The author is not offering any professional advice of any kind. The reader should consult a professional financial advisor to determine their suitability for any strategies discussed herein. The article is written for helping users collect the required information from various sources deemed to be an authority in their content. The trademarks if any are the property of their owners and no representations are made.
Reference
https://www.theoptionsguide.com/short-call-synthetic-straddle.aspx
Image Source
Get Market data in Excel easy to use formulas
- Real-time Live Streaming Option Prices & Greeks in your Excel
- Historical (intraday) Options data in your Excel
- All US Stocks and Index options are included
- Real-time Option Order Flow
- Real-time prices and data on underlying stocks and indices
- Works on Windows, MAC or even online
- Implement MarketXLS formulas in your Excel sheets and make them come alive
- Save hours of time, streamline your option trading workflows
- Easy to use with formulas and pre-made templates

I invite you to book a demo with me or my team to save time, enhance your investment research, and streamline your workflows.