Sortino Ratio Of Portfolio (With Marketxls Formulas)
")
Meet The Ultimate Excel Solution for Investors
- Live Streaming Prices Prices in your Excel
- All historical (intraday) data in your Excel
- Real time option greeks and analytics in your Excel
- Leading data in Excel service for Investment Managers, RIAs, Asset Managers, Financial Analysts, and Individual Investors.
- Easy to use with formulas and pre-made sheets
We know that Sharpe ratio is one of the most common ratios to measure the reward versus the risk of an investment opportunity. Sortino ratio is a modified version of the Sharpe ratio. While the Sharpe ratio measures the return over the overall risk (stock volatility) in the portfolio, Sortino ratio only considers the downside risk in the portfolio. In this article, we will learn about what Sortino ratio is, how MarketXLS calculates it, and how to calculate the same in Excel using MarketXLS functions.
Contents:
- What is Sortino Ratio?
- Using Sortino Ratio
- How MarketXLS Calculates Sortino Ratio
- Sortino Ratio in Excel
What is the Sortino Ratio?
Sortino ratio is a modified version of the Sharpe Ratio. It is named after Dr. Frank Sortino from the Pension Research Institute. A higher Sharpe ratio signifies relatively less risk. In other words, even if a portfolio’s performance is average and the risk is low, the Sharpe ratio will become large. This is, however, not enough because investors don’t just want to look at the average performance of a portfolio. And this is where the Sortino ratio differs from the Sharpe ratio. Instead of using standard deviation as the denominator, it uses only downside deviation.
Sortino ratio measures excess return to the risk of not meeting an investor’s MAR.
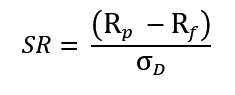
Where:
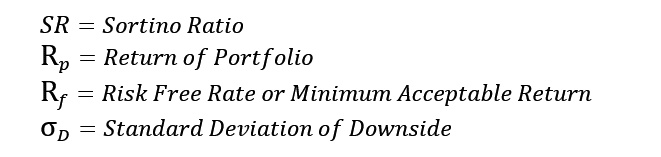
Minimum Acceptable Return refers to a rate determined by the investor which may be an absolute return, an index return, a risk-free rate, or even zero.
The important thing to note here is that Sortino ratio quantifies downside volatility without penalizing upside volatility thereby addressing the shortcomings of Sharpe ratio.
Using Sortino Ratio
Sortino ratio is suitable as a relative measure to compare the performance of portfolios, one fund with another, or to compare a fund with a benchmark index. A higher ratio indicates better risk-adjusted-performance. It indicates a low risk of incurring large losses (because it considers only downside volatility).
Let’s take an example to understand this. Let’s say you are considering an investment in two funds A and B. Fund A has a return of 10% in the first year and -10% in the second year. Fund B has a 0% return in the first year and a 20% return in the second year.
For both Funds A and B, the total variance is the same, i.e., 20%. However, Fund B is definitely a better investment. Sharpe ratio will not differentiate between the two investments. However, the Sortino ratio will spot the negative volatility in Fund A and will be able to identify Fund B as a better investment.
How MarketXLS Calculates Sortino Ratio of Portfolio
MarketXLS® completely automates the process of calculating the Sortino ratio and returns an annualized value to facilitate maximum comparability between different portfolios.
For either the ex-ante or ex-post, the following inputs are required:
Required Fields:
- Symbol of the asset:
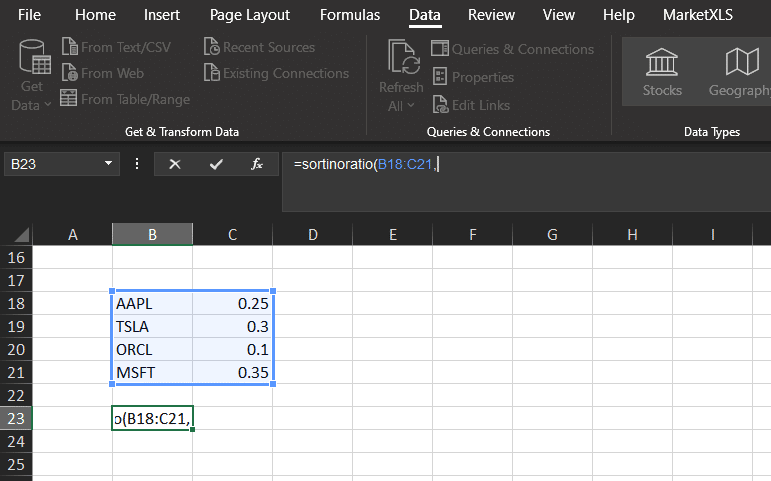
Enter the ticker under which the security in your portfolio is traded. - Weight of the asset in your portfolio:
Enter the percentage weight of each security as shown below.
Example:
Optional Fields:
- Minimum acceptable return(Mar)/ risk-free-rate(Rf):
To account for individuality in investor outlook, we make sure to give you the flexibility of determining what Mar/Rf you think is most viable. Default value: marketXLS assumes a Mar/Rf of 0% by default to calculate the ratio. - Months under observation:
To determine how many months you want to utilize retrospectively to arrive at your calculation, you may input the number of months you feel best, given that all the securities in your portfolio have existed long enough to have data for those periods. Default Value: In the absence of any user input, marketXLS uses the data for the preceding 12 months from the date of query.
Calculation:
The following is how the MarketXLS add-in calculates the Sortino ratio of portfolio, one may note, that this also serves as an explanatory step-by-step guide as to how to calculate the ratio.
1. Weighted Monthly Return Calculation:
Monthly return is calculated as follows: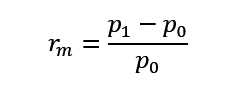
Where:
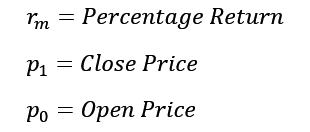
Note: to maintain consistency with theory in this regard, Close Price is a security’s Adjusted Close of the last day of a given month and the Open Price is the Adjusted Close price for the last day of the previous month.
The values so received are multiplied by the respective weights of each security in the portfolio, and their sum is the weighted return for that month.
This process is repeated for all the months that are to be taken into consideration.
2. Average Monthly Return Calculation:
The average portfolio monthly return is calculated by taking the mean of values arrived at in step 1.
3. Standard Deviation of Downside calculation:
The portfolio downside values are calculated as follows:
- MAR is subtracted from individual values of the monthly returns
- The value of the downside is either 0 or the value attained in the step above, whichever is lower.
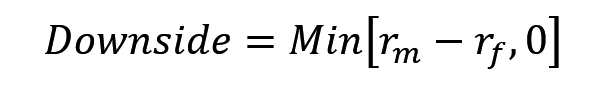
This is repeated for the data for each month.
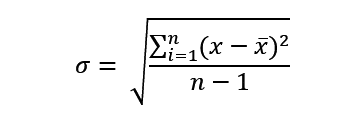
The downside deviation is calculated using the following formula for the Monthly Downside as calculated above :
4. Calculation of Sortino Ratio:
Consequently, all necessary components to calculate Sharpe ratio are available we can simply calculate the Sharpe ratio as follows:
Note: Since the calculation is based on monthly data, a monthly estimation of the risk-free-rate should be used.
5. Annualising the Resultant Ratio:
The Sortino ratio is annualized by multiplying the value attained in Step 4 with the square root of 12. This number is used because monthly data is utilized for the given stocks.
Sortino Ratio in Excel
We have created a template to calculate the Sortino Ratio in Excel. Especially relevant is that we can calculate the Sortino ratio in Excel using MarketXLS functions. In the template, where you can enter your stock portfolio and it will automatically calculate the Sortino Ratio of the portfolio. Also, the template is flexible and we can extend it to calculate the Sortino ratio of any portfolio.
Let us review the steps involved in calculating the Sharpe Ratio of Portfolio in Excel.
1. Get Daily Stock Prices
Get daily stock prices for the last one year for each stock in your portfolio. To do this, simply add the stock symbols in Excel, select the cells containing the symbols, and then press the ‘1 Year Data’ button in the MarketXLS panel.
2. Calculate Daily Returns
Calculate daily returns for the period using the following formula:
Periodic Return = (Price 1 – Price 0) / Price 0
Note: Here, Price 1 is the adjusted close of the last day of the present period, and price 0 is the adjusted close of the last day of the previous period. The period could be days, weeks, months, or even years.
3. Calculate Excess Returns and Excess Negative Returns
Using the periodic returns and MAR, you can calculate the excess returns and also the negative excess returns.
4. Calculate Average Annualized Excess Returns and Downside Volatility
We can now calculate the annualized excess returns and also the downside volatility using the negative excess returns.
5. Calculate Sortino Ratio
Finally, you can calculate the Sortino ratio using the formula provided above.
6. Annualise Ratio
Finally, to facilitate comparison among different portfolios, annualize the Sortino ratio by multiplying it with the annualizing factor as follows:
Annualizing Factor = SQRT(Number of Periods a Year)
For instance, if taking daily data, seeing as a trading year has 252 days, multiply the ratio with the square root of 252 to arrive at the annualized value of the ratio.
Similarly,
-
-
-
- for yearly returns, annualizing factor = SQRT(1)
- for monthly returns, annualizing factor = SQRT(12)
- for weekly returns, annualizing factor = SQRT(52)
- for daily returns, annualizing factor = SQRT(252)
-
-
MarketXLS has a function called the Sortino Ratio. You can simply use this function to calculate the Sortino ratio for stocks.
=SortinoRatio(“Stock Symbol”, Optional [“Period”], Optional [“Risk Free Rate”])
This function will report the Sortino Ratio of the stock within the time period specified. The default period is twelve months and the default risk-free rate is zero.

I invite you to book a demo with me or my team to save time, enhance your investment research, and streamline your workflows.