")
Value Investing is the investment philosophy adhered to by John Templeton, one of the best-known investment advisors today. While in college, Templeton studied under one of the forefathers of value investing, Benjamin Graham.
When implementing a value investing strategy, there are several ways to create the screen. However, when screening for value in the form of attractively priced stocks, the foundation is often low price-earnings ratios. This Templeton screen is no different, incorporating a low price-earnings requirement as its base.
The John Templeton Value is an investing strategy that combines value and growth factors to find and identify stocks trading at low prices but having a positive long-term outlook. The components of this investing strategy include the stock’s price to book and price to earnings ratios. These two are the main value components. The growth components are solid margins and earnings and low debt. Sir John had said, “Bull markets are born on pessimism, grow on scepticism, mature on optimism, and die on euphoria. The time of maximum pessimism is the best time to buy, and the time of maximum optimism is the best time to sell.” He lay down sixteen rules of value-investing. Let us look at a few of them.
Rule 1: Invest, don’t gamble.
Often traders treat the stock market as a casino, and in their lookout for easy money, they overestimate their chances of success. However, unlike a casino, the stock market has risks that are not as clearly defined, and investors face uncertain unknowns. Templeton also said that no matter how careful one is, nobody can predict the future. Hence his advice is simple: Buy value and quality; and diversify—by industry, risk, and country.
Rule 2: Invest in value and quality.
Templeton emphasised the quality of a stock before investing in it. A temporarily bullish market may pull up individual stocks, but it is important to note that individual stocks make up the market. If investors focus too much on market trends and the stocks; performance doesn’t coincide with the market predictions, then it can cause significant losses. So buy individual stocks, not the market trend or economic outlook.
Rule 3: Invest when the going is tough.
When the market performs well, most people are buying stocks, and when the prices are low, demand reduces, and investors become collectively pessimistic, so the entire market collapses. Thus it is not always safe to follow the market sentiment blindly. In simpler terms, it is impossible to outperform the market if one is only following the market. A good investor uses their discretion and intuition while trading.
Rule 4: Invest for maximum total real return.
Although it may be tempting to trade your investments according to the market’s movements frequently, brokerages and taxes can easily consume the profits. One should look at the total return of a trade, including the commissions, taxes, and inflation, before undertaking it. Templeton suggests that the entire portfolio should not only contain fixed-income securities but also contain some equity.
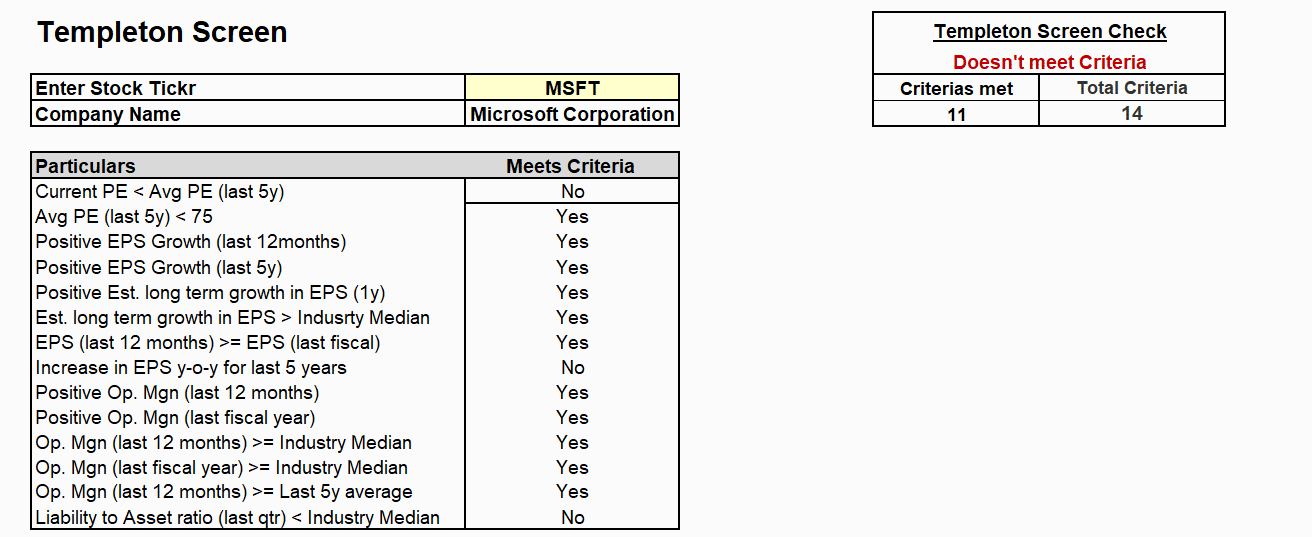
In order to be eligible for the Templeton Screen, stocks have to meet specific criteria:
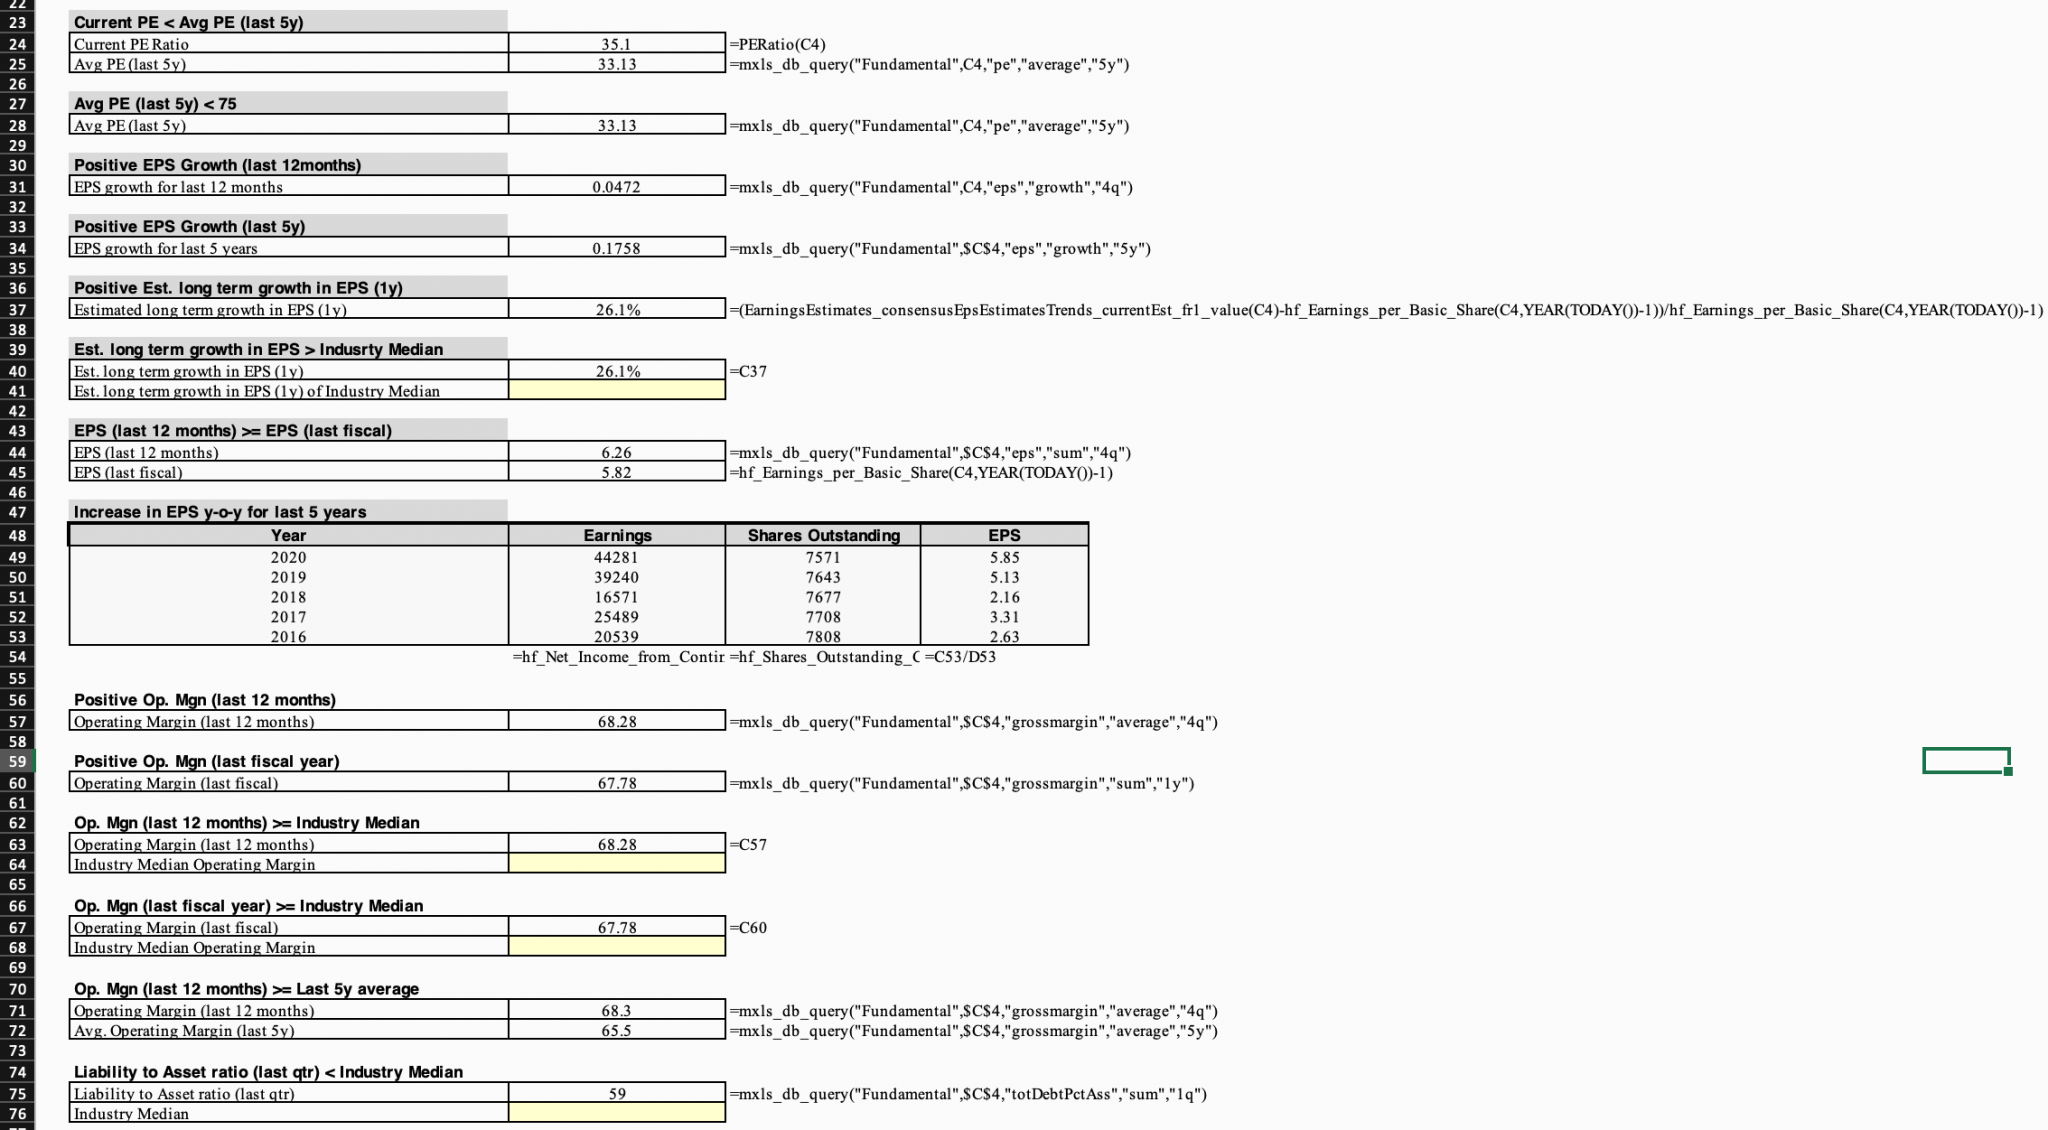
• PE Ratio < Average PE ratio for the last 5 years
• Average PE ratio for each of the previous 5 years < 75
• Growth rate in EPS over the last 12 months is positive
• Growth rate in EPS for the last 5 years is positive
• Estimated long-term growth rate in EPS is positive
• Estimated long-term growth rate in EPS > Industry’s median estimated long-term growth rate in EPS
• EPS for the last 12 months >= EPS for the last fiscal year (Y1)
• Year-to-year EPS have increased over each of the last 5 years (Y5 to Y4, Y4 to Y3, etc.)
• Operating margin for the last 12 months is positive
• Operating margin for the last fiscal year (Y1) is positive
• Operating margin for the last 12 months >= Industry’s median operating margin for the same period
• Operating margin for the last year (Y1) >= Industry’s median operating margin for the same period
• Operating margin for the last 12 months > Average operating margin for the last 5 years
• Ratio of total liabilities to total assets for the last quarter (Q1) < Industry’s median ratio for the same period
Let us now see how we can make use of the MarketXLS Template to understand the Templeton Screen
In the template:
1. Enter the stock ticker in cell C4 in the Active Template tab
2. Enter values in Yellow highlighted cells for industry median values
3. The final result if the stock qualifies for the Templeton screen can be seen in cell F3
Here we are considering the stock for Microsoft Corp. (MSFT). Out of the 14 listed criteria set by the Templeton Screen, MSFT manages to meet only 11 of them. The template also calculates the increase in EPS on a yearly basis for five years. The OPS is calculated and compared with the industry median and the five-year average.
The Bottom Line
John Templeton’s Growth Fund delivered a 13.8% annualized return from 1954 to 2004, well ahead of the S&P 500’s 11.1% over the same period. The AAII implementation of this screen saw a 10-year return of 8.2% versus S&P 500’s -2.9% as of 26/02/2021.

Source: AAII
Sir John also emphasized qualitative factors, such as quality products, cost controls, and the intelligent use of earnings by management. One may follow Templeton’s advice to find stocks having lower than average price to earnings ratio and companies with increasing earnings growth rates. In other words, one may follow the Templeton way and “buy when there’s blood in the streets.”
It may also be helpful to remember his advice: “Bull markets are born on pessimism, grow on scepticism, mature on optimism and die on euphoria. The time of maximum pessimism is the best time to buy, and the time of maximum optimism is the best time to sell.”
Disclaimer
None of the content published on marketxls.com constitutes a recommendation that any particular security, portfolio of securities, transaction, or investment strategy is suitable for any specific person.
The author is not offering any professional advice of any kind. The reader should consult a professional financial advisor to determine their suitability for any strategies discussed herein.
The article is written for helping users collect the required information from various sources deemed to be an authority in their content. The images, copyrights, and trademarks if any are the property of their owners, and no further representations are made.
References
https://www.aaii.com/stocks/screens/68
https://morningstar.in/posts/49663/4-investing-rules-john-templeton.aspx
