Zweig Screen
Introduction
The strategy for Zweig Screen given by the investment advisor Martin Zweig is based on identifying companies with strong growth in earnings and sales. For a stock to meet the Zweig Screen check, it must meet many earnings-related criteria, which indicate potential earnings growth at a high rate in the long term. This means it should be consistent over several consecutive years, has accelerated in recent quarters, and is sustainable. This is the base of the strategy.
The screener entails screening publicly available data on several stocks using predetermined criteria. This enables individuals to follow a large number of stocks simultaneously, spending a limited amount of time on any one company. A company needs to meet specific predetermined criteria and certain parameters to be accepted on the Zweig Screen.
The Parameters
Let us look into those parameters:
• The P/E ratio should be above five and below 1.5 times the market median.
It has been observed that stocks with a low P/E ratio perform better than stocks with a high P/E ratio. But the P/E should not be too low. According to Zweig Strategy, stocks having a P/E of 5 or lower than that should be less preferred because it takes unusual and odd circumstances to produce such P/E values.
• Sales CAGR for the last three financial years should be more than 15%.
The Compound Annual Growth Rate of the company’s sales should be more than 15% for the past three years. This will ensure a stable growth rate of the company’s sales.
• EPS CAGR for the last three financial years should also be more than 15%.
The Earnings Per Share CAGR should also be more than 15% for the last three financial years. This will ensure good annual earnings growth and shareholders’ satisfaction.
• EPS for the last three years should be growing on a YoY basis.
This is to assure you that nothing has gone wrong recently.
• The one-year stock return for the company should be greater than the overall share market.
Zweig says that if a company is as good as it appears, it should perform better than the share market or at least as well as the share market. This represents the strength of the company and eliminates some amount of risk as well.
• The debt to asset ratio of the company should be less than the market median value.
Zweig wanted a firm’s debt/asset ratio to be low compared to the market median value. The market median value is calculated based on NASDAQ – 100 stocks.
• There should be at least three insider buy activities for the past three months and an absence of heavy insider selling.
This will ensure insider support. He focuses less on insider buying but more on insider selling.
There will be a positive signal in the Zweig Screen Check if the stock meets the parameters mentioned above.
The Zweig Screen in MarketXLS
MarketXLS has a ready template for the Zweig Screen using which you can identify those stocks that meet the screen parameters and have the potential to see growth in the future.
The software provides a ready template and an explanation of the screen and the fundamentals required for a stock to meet the Zweig Screen criteria. It consists of various complex functions.
How to use the Template:

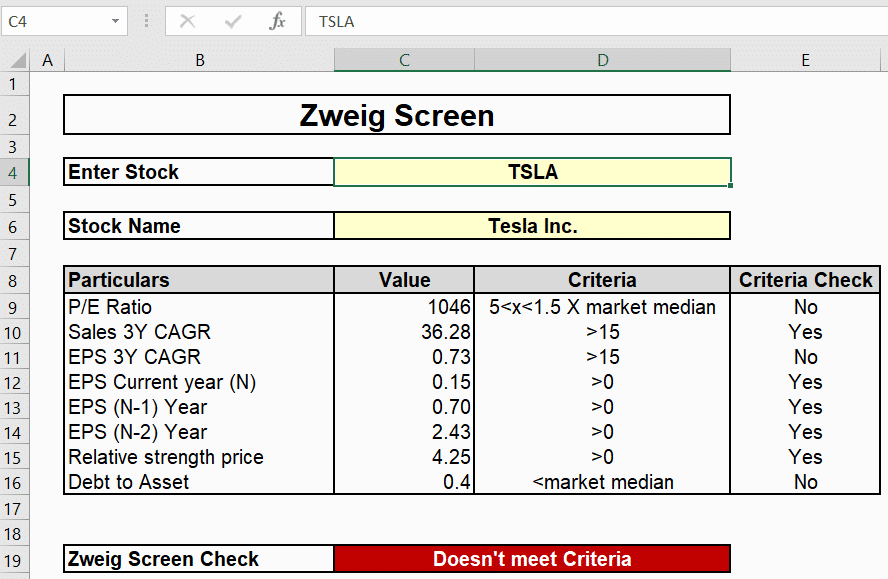
This is the ready template of the Zweig Screen provided by MarketXLS.
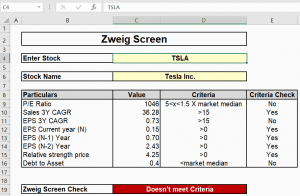
You have to enter the Stock Ticker in cell C4. Other results will be calculated automatically by the template and will return the result in cell C19.
We have taken an example of the stock ‘Tesla’ having its ticker as ‘TSLA.’ We can see that the stock doesn’t meet the Zweig Screen criteria.
This is because of three reasons. It has not met the following three parameters:
1. Its P/E ratio is 1046, which is much higher than the criteria.
2. Its three-year Compound Annual Growth Rate of Earnings Per Share is not greater than 15. It is only 0.73.
3. Its Debt to Asset ratio is 0.4, which is not less than the market median.
The P/E ratio and Debt to Equity ratio’s market median is provided in one of the template sheets. You don’t have to calculate it. The software will do all the calculations.
How successful has the screen been?
The screen was monitored in the fifteen years from 1980-1995. During this period, Zweig’s stock newsletter returned an average of 15.9%per year, during which time it was ranked number one, based on risk-adjusted returns.
To judge the market as a whole, Zweig gives greater weight to technical analysis than fundamental analysis. To evaluate individual stocks, he gives greater weight to fundamental analysis than technical analysis.
This is not a buy-and-hold strategy. Zweig places heavy emphasis on risk minimization and limiting losses. For loss limitation, Martin Zweig’s basic stock market strategy is to be fully invested in the market when the indications are positive and to sell stocks when expressions become negative.
The Bottom Line
A GARP investing strategy that uses both fundamental analysis and market timing. It focuses on solid growth in earnings and sales, a reasonable price-earnings ratio given its growth rate, insider support, and relatively strong price action.
The pictures and graphics used were taken from this software itself – MarketXLS.
For more such useful information, please visit https://marketxls.com
Disclaimer
None of the content published on marketxls.com constitutes a recommendation that any particular security, portfolio of securities, transaction, or investment strategy is suitable for any specific person.
The author is not offering any professional advice of any kind. The reader should consult a professional financial advisor to determine their suitability for any strategies discussed herein.
The article is written to help users collect the required information from various sources deemed to be an authority in their content. The trademarks, if any, are the property of their owners, and no representations are made. All trademarks referenced are the property of their respective owners. Other trademarks and trade names may be used in this document to refer to either the entity claiming the marks and names or their products. MarketXLS disclaims any proprietary interest in trademarks and trade names other than its own or affiliation with the trademark owner.
Reference
https://www.businessinsider.com/martin-zweig-growth-investing-screen-how-does-it-work-2011-6?IR=T


