Learn the fundamentals of covered calls and how they generate income
12 minutes read
Master covered call strategies from the ground up. Learn the fundamentals, build powerful Excel screeners, and manage positions like a professional trader using MarketXLS.
Learn the fundamentals of covered calls and how they generate income
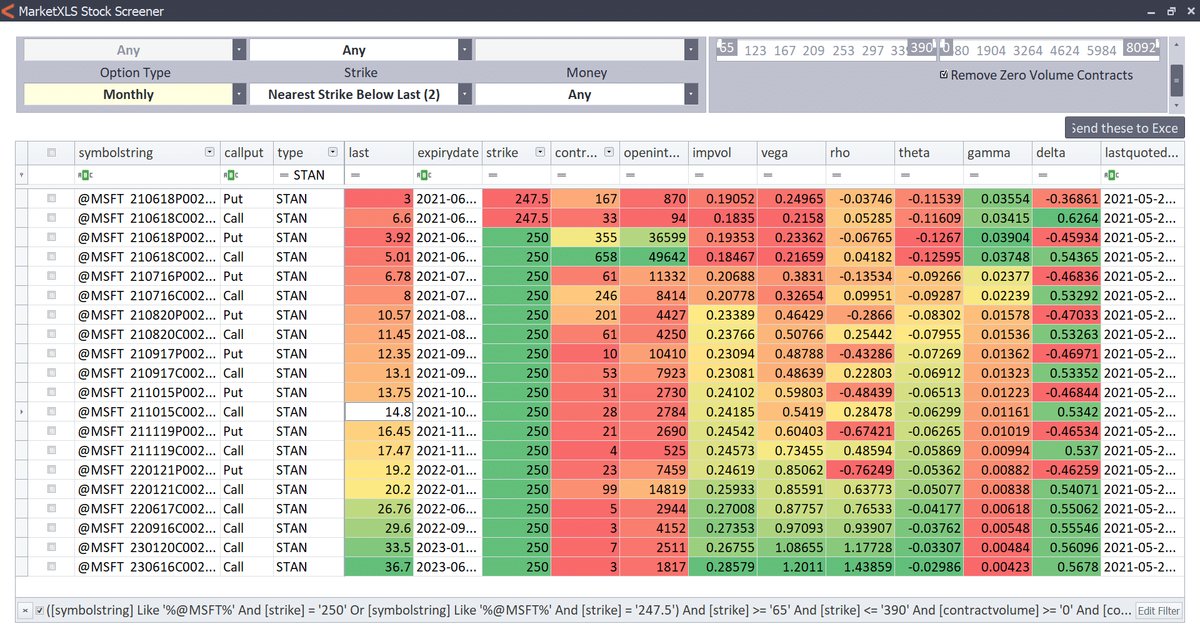
Build a powerful screener to find the best opportunities
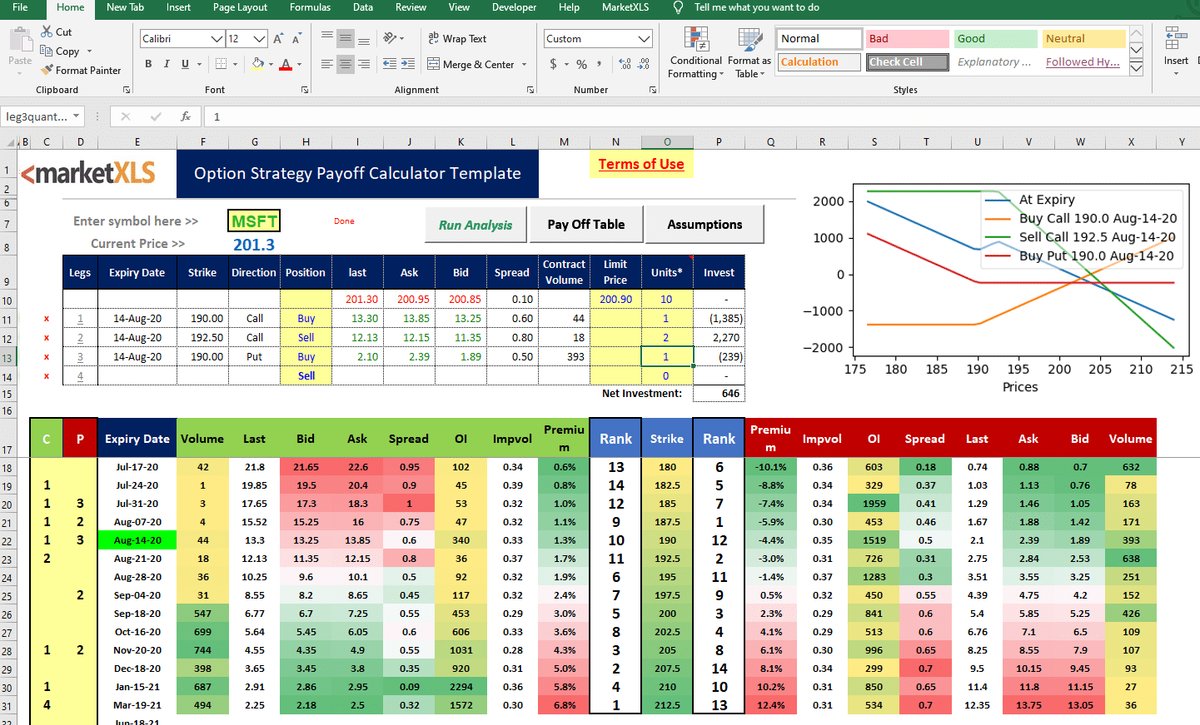
Track performance and optimize returns like a professional