Using Marketxls And Excel To Easily See A Real Time Snap Shot Of Your Portfolio

Meet The Ultimate Excel Solution for Investors
- Live Streaming Prices Prices in your Excel
- All historical (intraday) data in your Excel
- Real time option greeks and analytics in your Excel
- Leading data in Excel service for Investment Managers, RIAs, Asset Managers, Financial Analysts, and Individual Investors.
- Easy to use with formulas and pre-made sheets
I have been learning to invest over the past 2 years—it is so much fun! My investments are spread over 3 different brokerage accounts, but I like to look at all of them together.
MarketXLS, combined with my knowledge of Excel, allows me to manage my stock portfolio in Excel.
Since I’m only about 2 years away from retirement, my primary goal has been to create an income stream that will replace at least 60% of my projected living and discretionary expenses. Social Security will supply the other 40%.
The majority of my investment savings is in work-related 403b funds and I don’t have much control over these.
So I’ve been practicing with a small (but growing) amount of money, trying to build my confidence so that I feel comfortable taking control of all my savings when I retire.
As I’ve practiced, I’ve finally settled on Dividend Growth Investing as the style that meets my goals and feels comfortable to me. This means that I mostly buy stocks that pay a dividend and have a history of increasing the dividend each year. Capital gains are icing on the cake.
I also try to buy stocks when they are undervalued, based on several metrics such as current vs historic P/E, projected earnings growth, and current price as it relates to the 52-week highs and lows. This increases the dividend yield on cost (YOC), which is one of the portfolio performance measures that I track.
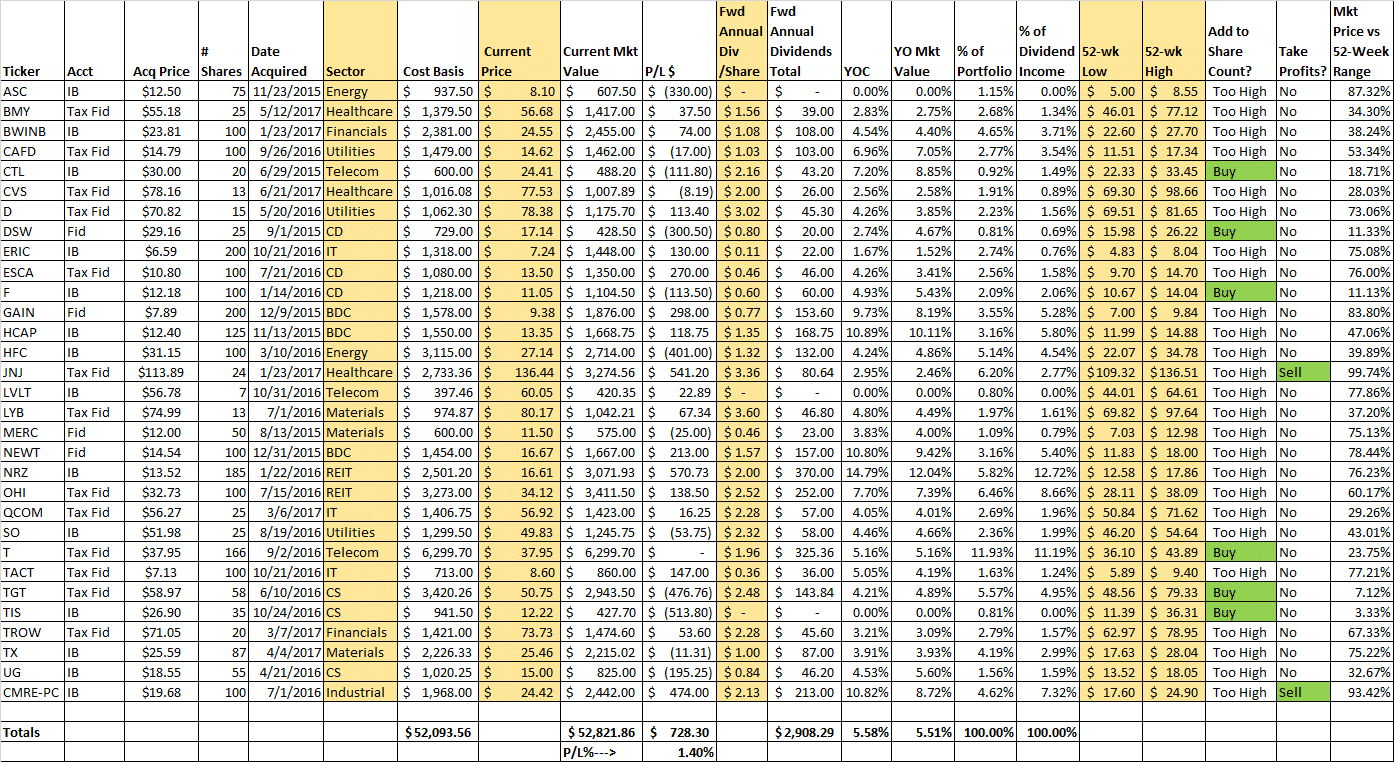
Here is my basic portfolio tracker and details on how I manage my stock portfolio in Excel
MarketXLS supplies the values in the gold-colored cells…I refresh them whenever I open the spreadsheet.
Several columns are created using Excel formulas that rely on the data in the gold cells. For example:
- Current Mkt Value is just the Current Price x # of shares
- P/L $ is the capital gain (or loss) on that equity (you can see that is not my primary focus!)
- Forward Annual Dividends is the Annual Dividend per Share x # of shares. I now receive $2900 in income each year…this is a 5.58% yield on cost. Thankfully, as the companies increase their dividends each year, this will grow….like getting a raise every year.
- YOC and YO Mkt Value are hopefully self-explanatory.
- Then I look at the % of my portfolio represented by that equity; and also the % of income I receive from that equity. You can see that > 20% of my income is from NRZ and T….so I probably don’t want to buy any more of those stocks for a while. I need to diversify a bit so that all my income eggs are not in the same basket.
- The last 3 columns are used to identify stocks in my portfolio that might be overpriced (and good candidates for selling or trimming), or undervalued (and good candidates for buying additional shares). These columns were created as follows:
- Add to Share Count uses the formula =IF(H2<(0.25*(R2-Q2)+Q2),”Buy”,”Too High”) which is basically looking at the difference between 52-wk low and high, and where the current price is on the continuum. For example, if the low = $10, and the high = $20, and the current price = $14, then the current price is 40% of the distance between the low and high. My formula will show “Buy” if the stock price is less than 25% of the distance between the low and the high. This is my somewhat arbitrary personal preference. I then use Conditional Formatting to make the word “Buy” have a green background so I can see it more easily. This is just a preliminary flag to buy (you would need to do additional due diligence).
- Take Profits column is very similar. It uses the formula =IF(H2>(0.9*(R2-Q2)+Q2),”Sell”,”No”) which will suggest I should consider selling or trimming the position of a stock if it is more than 90% of the distance between its 52-week low and high. Again I use Conditional Formatting to Highlight the word Sell. And again I would use this signal as a preliminary suggestion that would require additional due diligence before making a trade.
- The Mkt Price vs 52-Week Range column calculates the exact point along the range.
- At the bottom of the table I calculate the cost basis, current value, forward dividends, yield, etc for the portfolio as a whole.
From this table, I create a few pivot tables and charts
. Here are a few examples:
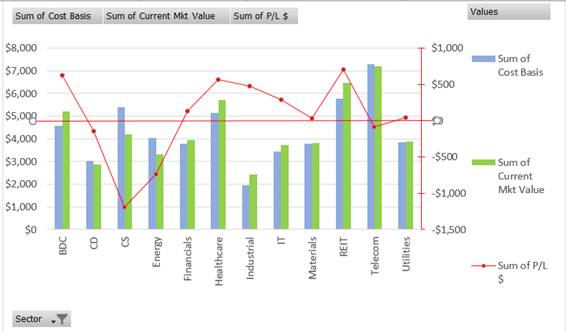
This first pivot chart breaks things down by sector (I take some liberties with sector assignment…for example I track Business Development Companies – BDC – separate from other Financial Sector stocks).
- My cost basis for all the stocks in that sector is in the blue column.
- The green column is the current market value for all the stocks in that sector.
- The red line uses the Y-axis on the right-hand side and shows which sectors have a capital gain and which have a capital loss, and the value of that gain or loss.
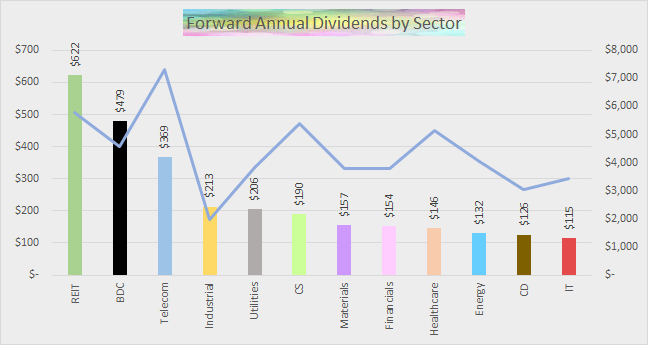
I also like to look at where my income (dividends) comes from. The columns in the chart above show forward annual dividends by sector. The blue line, which uses the Y-axis on the right, shows the cost basis for the stocks in that sector. You can see my cost basis is highest in the Telecom sector but both the REIT and BDC sectors generate more income (they tend to have higher yields).
(I had too much fun playing with colors on this one).
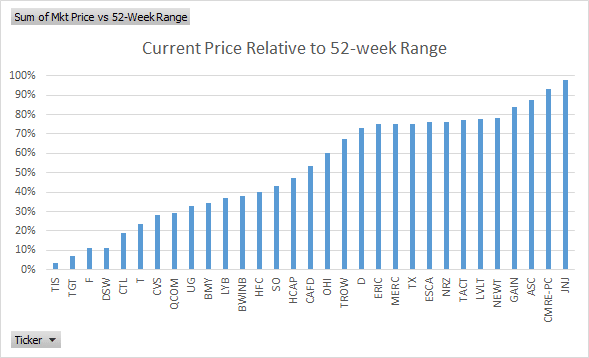
I also plot the last column from the first table I showed you….to see a graphical representation of which of my stocks are doing great, and which are not so good (from a cap gains perspective).
As shown, Orchid Paper (TIS) is pretty beat down, while Johnson and Johnson (JNJ) is near its 52-week high.
These are just a few of the fun (and useful!) things you can do when you combine MarketXLS with your knowledge of Excel. I love being able to manage my stock portfolio in Excel (from 3 brokerage accounts) easily. Without MarketXLS I could not really do this. I would have to manually update the gold fields in the table, and that would be no fun at all.
** By kindkath – MarketXLS User

I invite you to book a demo with me or my team to save time, enhance your investment research, and streamline your workflows.