Volatility surface is the plot that can help you determine the best combination of the strike and the expiry date to maximize the profits on an Options Trade.
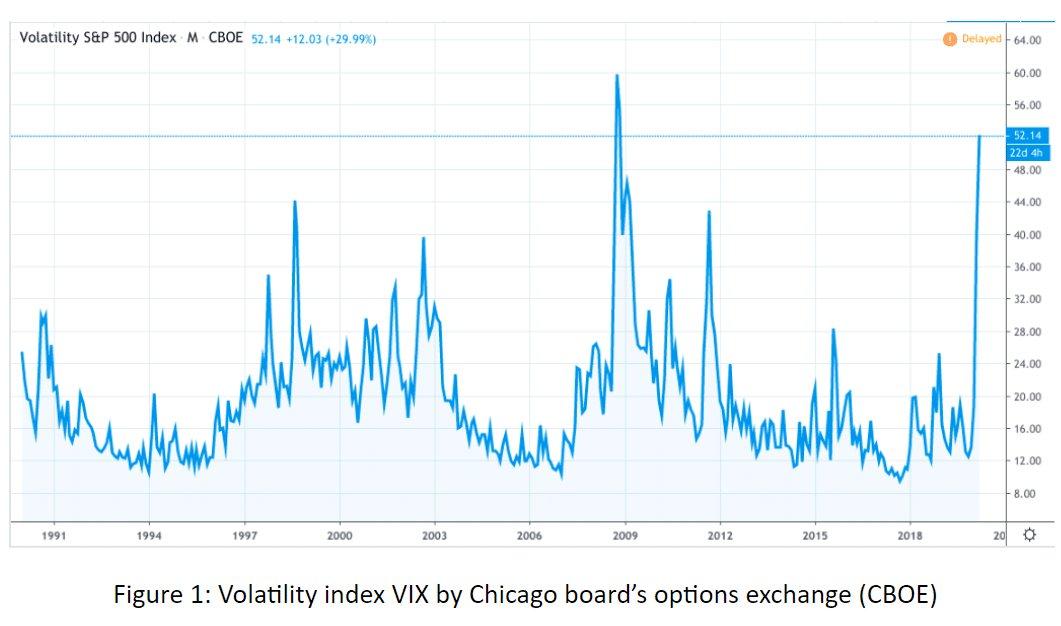
**Volatility **Volatility is basically the fluctuation in the price of a product or a derivative. The more is the swing, the more is the volatility. There are many factors that cause volatility in the market, major ones being the increase in market participants and their anticipation of the market in the near future. Volatility is a very useful tool, especially for trading options. The profitability of an options trade revolves around volatility. However, an option seller is better off only when there is less volatility. But, volatility is also used by sellers to hedge their funds against sharp falls in stock prices.
For example, an option buyer will profit only from a huge move in the stock price as he has to pay a premium to the seller and he will have to earn at least equal to the premium to breakeven. We will discuss different types of volatility and how an options trader can gain from volatility in the market.

Volatility surface
Types of volatilityVolatility is broadly divided into two parts, historical and implied. Historical volatility is calculated on past data. It can be calculated using basic statistical tools like Standard deviation and variances in excel. But for a trader, historical data is bare of any use, and only the ability to forecast future volatility would help a trader to design strategies to maximize profits. And, this forecasting of future volatility is called implied volatility. It doesn’t give the exact data about volatility but it gives a rough idea to start with.
Implied volatility is calculated based on the news, good or bad that is to occur during the lifetime of an option. It also takes into account the current stock price and the strike price of the option.**Black-Scholes model (BSM)**This particular model cannot be overlooked while talking about volatility. It was a formula developed by three economists – Fischer Black, Myron Scholes, and Robert Merton in 1973. It was developed to calculate future option prices based on call option price, current stock price, strike price, risk-free rate, and time to maturity. But it had its own drawbacks. Firstly, it is only applicable to European markets, where the options can only be traded on the date of expiry, while in US markets an option can be traded prior to the date of maturity.
One more shortcoming of the model was observed after the “Black Monday” stock market crisis in 1987. The volatility of the same options was varying while BSM assumes the volatility to be constant for the same options while calculating Price. It was observed that the same options with different strike prices or maturity showed different changes in volatility. This gave rise to a new concept “Volatility smile” or “volatility skew”.Volatility smileIt derives its name from the fact that when implied volatility is plotted against various strike prices the graph looks like a smile. The implied volatility is far from being flat which contradicts the BSM model. From the image below, we can say that implied volatility is high when the price is far from the strike price and decreases when the price approaches the strike price from either side. But it doesn’t always work this way.
Graphs are found to be skewed to their left or right based on market sentiments.

Reverse skew happens when the IV is more on the put side because most of the options buyers are anticipating the stock to go down. There can be many reasons like news and the fact that most options traders are long on stocks and they want to hedge against a possible fall in the stock price. Forward skew is exactly the opposite.

A volatility surface is basically a plot to examine the best possible scenario based on the strike price and expiry date for the maximization of profits from an options trade. Normally, Options with a shorter time to maturity have multiple times the volatility compared to options with longer maturities.
*/}(https://marketxls.com/blog/wp-content/uploads/2020/11/Implied-Volatility-Surface-for-AAPL.png)
Figure 4: Plot of IV against days to expiration and strike price.ConclusionTo sum up, there are three major parameters an options trader should look into while buying or selling options which are implied volatility, strike price, and time to expiry. A good combination of these three can not only help a trader maximize his profits but also hedge his funds against huge losses. Normally a short expiry period and a strike price far from an anticipated price are preferred.
There are many strategies based on implied volatility. Some of them are listed below:
● Call spreads
● Put spreads
● Long straddle
● Strip straddle
● Short condor spread
● Short butterfly spread
● Short albatross spreadDisclaimerNone of the content published on marketxls.com constitutes a recommendation that any particular security, portfolio of securities, transaction, or investment strategy is suitable for any specific person. The author is not offering any professional advice of any kind. The reader should consult a professional financial advisor to determine their suitability for any strategies discussed herein.** References:**
Volatility smile and skew, here.
visualizing the volatility surface, here.
