

Magic formula investing is a well-known investment technique popularized by Joel Greenblatt in his book “The Little Book That Still Beats the Market”. This is a value investing approach that outlines how investors can systematically apply a formula to buy stocks in good companies at affordable prices. In magic formula investing, we rank companies by their return on capital and earnings yield, and then buy the stocks with the best combined rank.
Put another way, the magic formula invests in companies through a ranking system. The higher the return on capital and higher the earnings yield for a company, the higher the rank this company enjoys.
Joel Greenblatt has praised the magic formula in his book ‘The Little Book that Beats the Market’. He cites that it does in fact beat the S&P 500 96% of the time, and has averaged a 17-year annual return of 30.8%. (Source: https://www.gurufocus.com/news/802)
The step-by-step magic formula is described below:
Magic Formula Investing #### Step 1Establish a minimum market capitalization (such as $50 million) to get a list of all stocks that meet the criteria.
####** Step 2**Exclude utility and financial stocks
####** Step 3**Exclude foreign companies (American Depository Receipts)
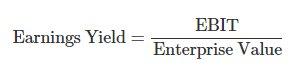
####** Step 4**Determine Earnings Yield of the companies
Greenblatt uses the concept of earnings yield in order to find out how much a business earns relative to the purchase price of the business.
Magic Formula Investing
Enterprise value (EV) is the sum of market value of equity (including preferred equity) and net interest bearing debt.
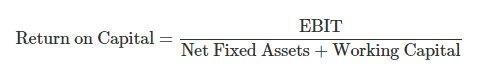
####** Step 5**Determine Return on Capital of companies
Greenblatt defines return on capital by measuring the ratio of the 12 month trailing EBIT (or operating earnings before interest and taxes) to tangible capital employed.
Using EBIT allows investors to compare the operating earnings of different companies without the distortions resulting from differences in tax rates and debt levels.
Tangible capital employed is measured as the sum of net working capital and net fixed assets.
Magic Formula Investing
####** Step 6**Finally, rank all the stocks by highest earnings yield and highest return on capital
####** Step 7**Invest in 20-30 highest ranked companies. Do so by accumulating 2-3 positions per month over a 12-month period.
Magic Formula Investing also recommends that you re-balance portfolio once per year. While rebalancing, sell losers one week before the year-mark and winners one week after the year mark. Furthermore, you should sell close to the intrinsic value. You should also sell if something even cheaper is found. Overall you need to stay invested for 3-5 years.
Greenblatt believes that magic formula investing provides returns far superior above the market averages, and more significantly, it achieves those returns on much lower risk than the overall market.
###** Magic Formula Investing Screener in Excel**
MarketXLS will allows to easily get the list of stocks ranked by magic formula with just a few clicks.
We will update the instructions shortly when the screen is complete.
