Covered Calls- Managing And Tracking

Meet The Ultimate Excel Solution for Investors
- Live Streaming Prices Prices in your Excel
- All historical (intraday) data in your Excel
- Real time option greeks and analytics in your Excel
- Leading data in Excel service for Investment Managers, RIAs, Asset Managers, Financial Analysts, and Individual Investors.
- Easy to use with formulas and pre-made sheets
A brief about covered calls
A covered call is a financial transaction in which an investor sells call options on his assets and earns an option premium. This is mainly done by investors who hold shares for a long period but are skeptical about the price movement in the short run. Instead of depending only on the rise in the value of shares, investors make use of it by selling call options on their underlying assets. It’s like renting out an asset. A trader who doesn’t own stocks can also leverage this strategy. He can buy stocks at a current price and write off options on the stocks. One can also sell options without having them just like shorting stocks. This is called writing. However, there are certain things that need to be looked into while using this strategy. The approach will also vary with the goals of a trader.
Before getting into a trade
• Stock types: This strategy works best with stable stocks. As long as the beta is 1 or less than 1 you are good to go. Because one doesn’t know, a stock may plummet to 0.
• Volatility: A stock can be stable but the volatility in the market can drive the best of stocks crazy.
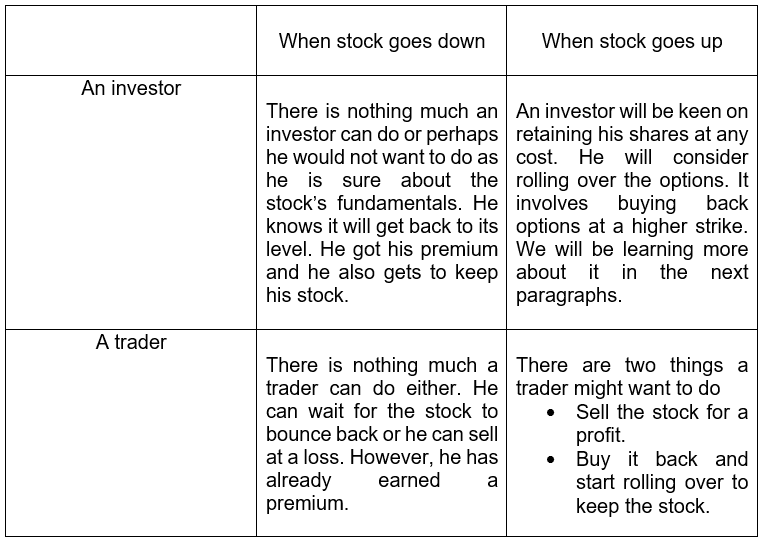
• Trader’s attitude: Knowing what one wants from a trade is equally important. An investor might hold a stock very dear and only looking to earn from a premium. But a trader might want to gain from both intrinsic and extrinsic values.
These are some of the factors a trader can look for before jumping in with this strategy. However, after the trades are executed the adjusting of options varies with the attitude of a trader. An investor should only get into a trade if he anticipates it to go down so that he gets to keep his shares.
After getting into a trade
There can be different scenarios based on the stock movement and the attitude of a trader. Let’s say there are an investor and a short term trader looking to write call options at a specific strike price. Below is a table depicting how things are going to pan out in various conditions:
Rollover
Rollover is basically keeping the options running by adjusting the strike prices and the expiry date. A trader who has sold call options might want to buy back if he thinks the stock is going to move up more. Or an investor might want to buy back with a hope to retain his shares.
For example, an investor sold call options at a strike of $50 for a premium of $1.50 with an expiry of 30 days. After the price reached near $50, say $48 or $49, the investor can buy back options at a lower price say $.50 with a higher strike of say $55. His net premium would be $1 and if the stock further moves, he can buy his shares back at $55.
Professional traders often maintain a journal to track their trades. However, it is very tiresome to carry out rollovers and track them in real-time. But, there is good news. It can be done easily with marketXLS. Apart from all the 600 financial functions to retrieve real-time data on stocks and the ability to analyze financial statements, the marketXLS package also comes with templates to track options trades on a real-time basis. Below is a marketXLS template to spot a potential rollover target. The idea is to look for a target on various expiry dates with the same strike price.
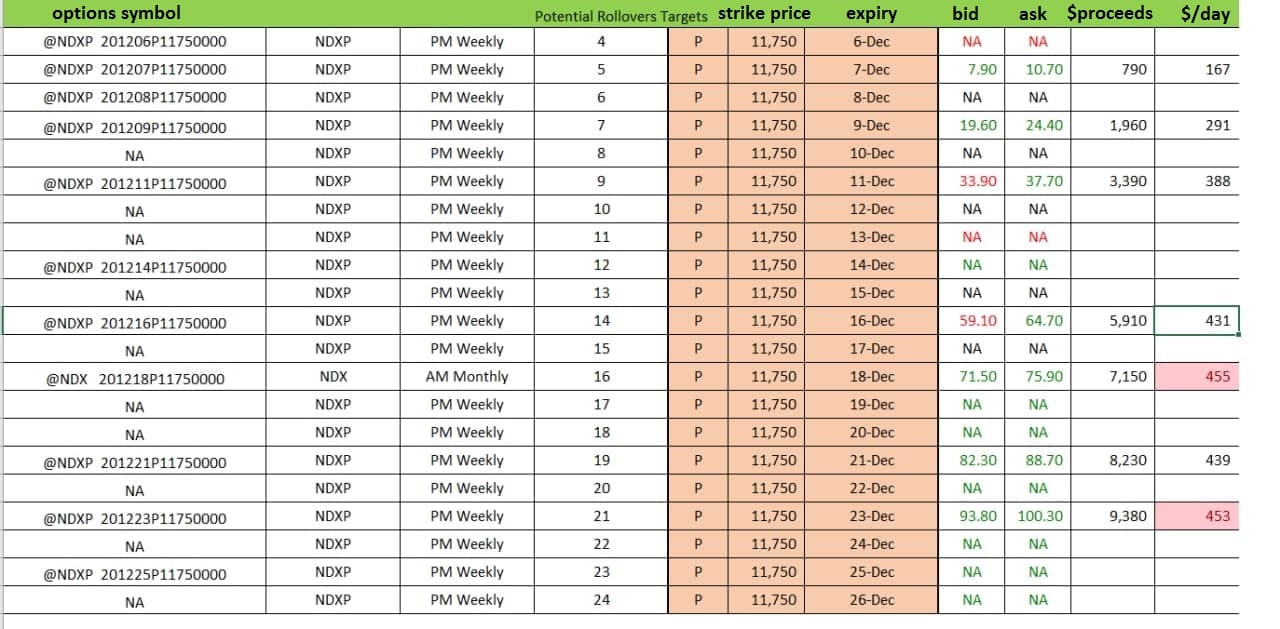
With the help of this marketXLS template, one can easily spot potential rollovers and their corresponding profits/losses as is shown in the last and second last columns.
Tracking Profits/losses
Now that you know the potential dates to gain profits, the next step would be to place your trades. But it is necessary to track them as well so that it gives an idea about when to exit a trade. Because sometimes the profits can turn into losses. This is when marketXLS tracking templates come in handy. You exactly know when to book profits and exit your trades. Below is an image for reference:
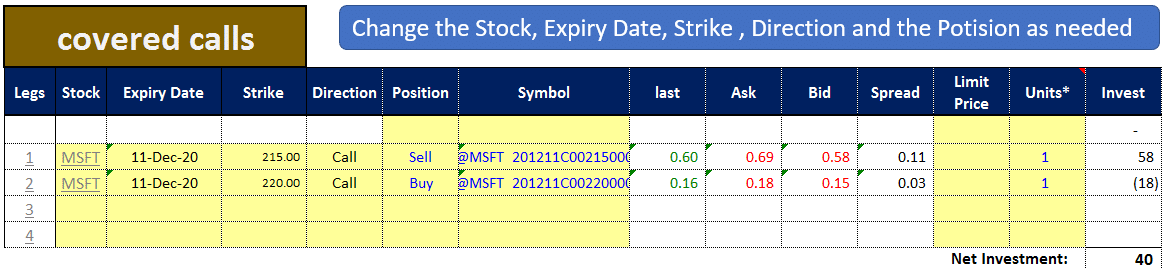
In this example, one contract of MSFT(Microsoft) is sold at $215 assuming that you already own the shares. When it nears the strike you buy back a call at $220 as you don’t want to let go of your shares. The total profits you are going to make is given in the bottom right corner. This particular template is for covered calls strategy, but you can design your own templates for different strategies by changing the stock, expiry, strike, direction, and position as needed. The marketXLS templates are very similar to the live option chains like yahoo finance as it contains all the necessary data required for a trade. They are also very flexible and can be modified according to users’ needs.
Disclaimer
None of the content published on marketxls.com constitutes a recommendation that any particular security, portfolio of securities, transaction, or investment strategy is suitable for any specific person.
The author is not offering any professional advice of any kind. The reader should consult a professional financial advisor to determine their suitability for any strategies discussed herein.
The article is written for helping users collect the required information from various sources deemed to be an authority in their content. The images, copyrights, and trademarks if any are the property of their owners, and no further representations are made.
References
Images from marketXLS.com
For more about rollover, read here.
For more about covered calls, read here.
Get Market data in Excel easy to use formulas
- Real-time Live Streaming Option Prices & Greeks in your Excel
- Historical (intraday) Options data in your Excel
- All US Stocks and Index options are included
- Real-time Option Order Flow
- Real-time prices and data on underlying stocks and indices
- Works on Windows, MAC or even online
- Implement MarketXLS formulas in your Excel sheets and make them come alive
- Save hours of time, streamline your option trading workflows
- Easy to use with formulas and pre-made templates

I invite you to book a demo with me or my team to save time, enhance your investment research, and streamline your workflows.