5 Successful Options Strategies Using The Most Liquid Options

Meet The Ultimate Excel Solution for Investors
- Live Streaming Prices Prices in your Excel
- All historical (intraday) data in your Excel
- Real time option greeks and analytics in your Excel
- Leading data in Excel service for Investment Managers, RIAs, Asset Managers, Financial Analysts, and Individual Investors.
- Easy to use with formulas and pre-made sheets

What are the liquid options?
TDSwsWXDi5MEqQlKjB87IdVNA-OJ7cLa32gka3ezyUZaev9VCnEbeWxXVUadVrHFxoudTzOa_pWVrleyaAeYfQekTrJbA1RtLA4t8S6yfZiB2gKQ7HuRykmnMxnjiw”>Liquid options are the ones that are traded frequently and are popular among the investors. Liquid options have a huge demand and supply in the market. It is always advisable to trade in liquid options as options contracts have a short term expiration period. Liquidity gives investors the flexibility to square off their position on or before the expiration. Liquid options facilitate adjustments while implementing complex strategies.
How to determine the liquidity of the options?
- Trading volume – The trading volume is the number of shares or contracts traded in a particular period. Higher trading volume indicates that a large number of buyers and sellers are trading the stock.
- Open interest- It gives an idea of the number of active contracts. Buyers and sellers are still holding their position on the contracts and are yet to square off it. Traders predict market sentiments by analyzing the open interest and trading volume.
- Bid/ask spread– A bid/ask spread is a difference between the ask and bid price. Liquid stocks have a low bid/ask spread as there is a large number of buyers and sellers dealing in that stock. A tight bid/ask spread indicates that the stock is traded at fair value.
You will get all this information and much more on a one-click with Marketxls– a tool to an extension of Ms.excel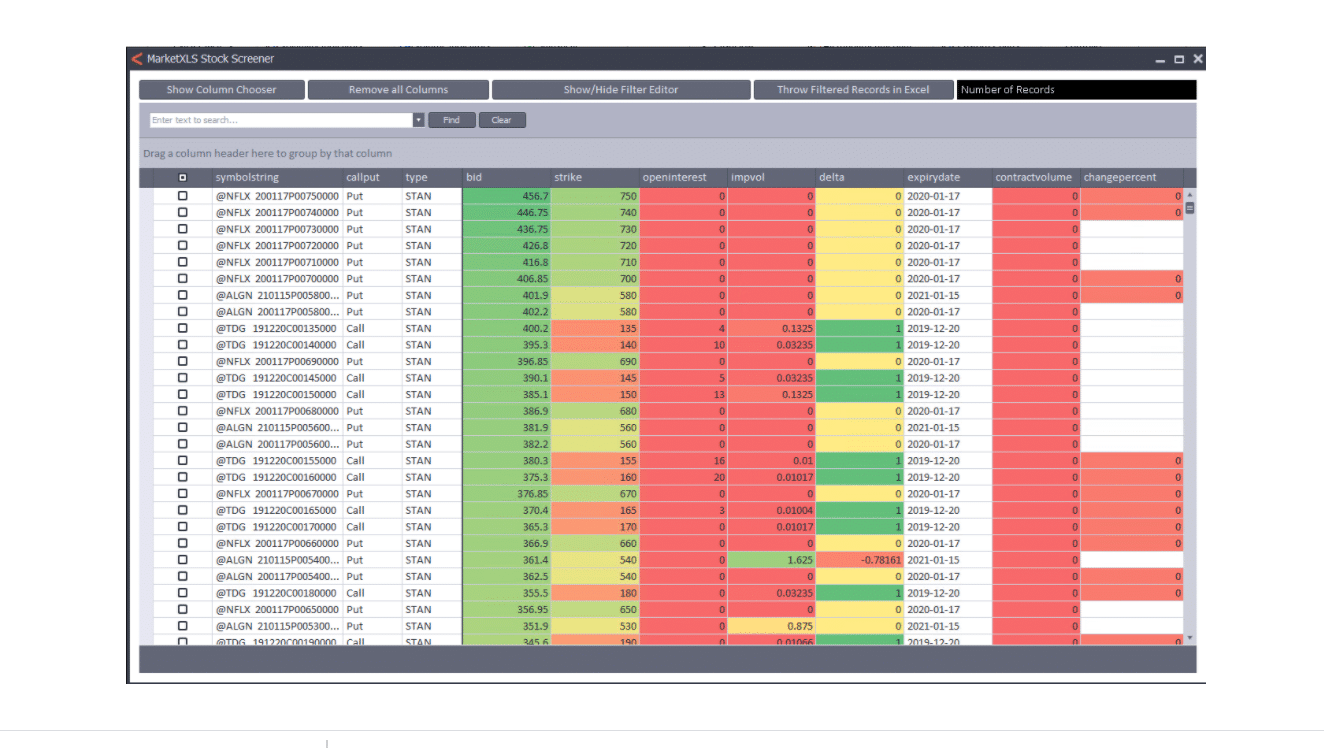
Let us see some of the successful options strategies using the most liquid options
1. Bull Call Spread
A bull call spread is a two-leg option strategy that consists of one long call with a lower strike price and one short call with a higher strike price. Both the calls should have the same underlying stock and expiration date. Risk is limited to the net debit cost of the spread(premium paid – premium received). It limits the risk but at the same time capping profit potential.
To Implement the bull call spread –
Buy 1 ATM call option (leg 1)
Sell 1 OTM call option (leg 2)
When you do this ensure –
- All strikes belong to the same underlying stock.
- Having the same expiration date.
- Each leg involves the same number of shares.
Example
Suppose an investor is bullish on the XYZ stock currently trading at $99,
He bought 1 100call at $4 and Sold 1 110call at $1(1Lot =100 shares).
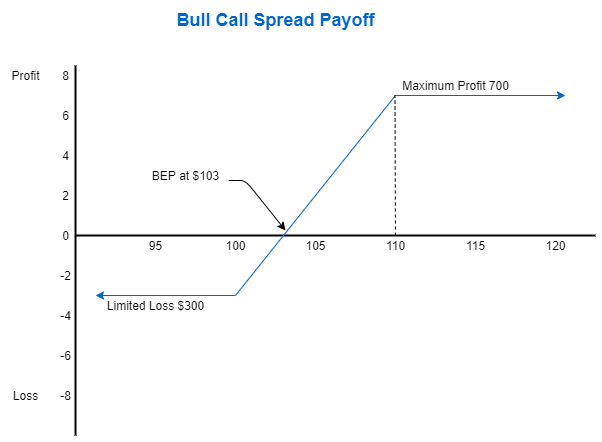
Maximum loss is equal to the difference in the premium of long and short options. We will achieve maximum gains when the spot price reaches the short strike.
Profit and Loss at different spot prices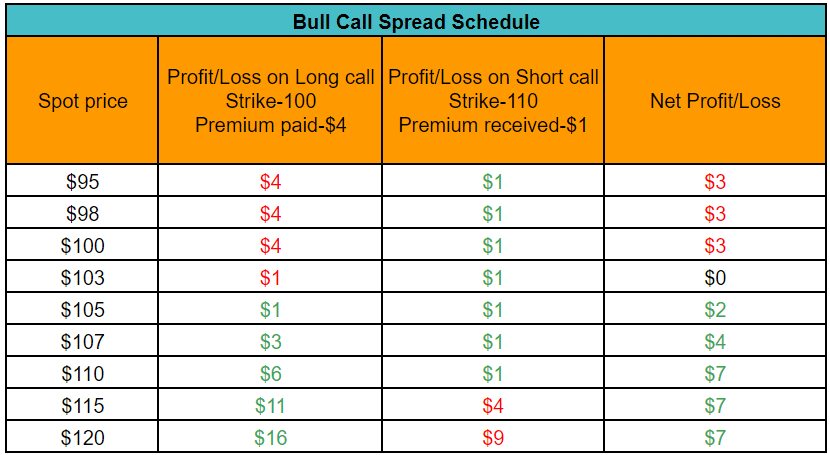
Key Metrics
- Net debit cost = $300 [($4-$1)*100].
- Maximum loss = Net Debit (Premium paid – Premium Received) = $300.
- Maximum Profit = Higher strike – Lower strike – Net Debit =$700 [(110-100-3)*100].
- Break-even= Strike of long call + Net Debit = $103.
Payoff Diagram
2. Bear Put Spread
As the name suggests, it is a bearish strategy consisting of 2 puts, one long put with a higher strike price and another short put with a lower strike. Both the puts should have the same underlying stock and expiration date. Like bull call spread, profits and losses are limited.
To Implement the bear put spread –
Buy 1 ATM put option (leg 1)
Sell 1 OTM put option (leg 2)
Example
Suppose an investor is bearish on the ABC stock currently trading at $65,
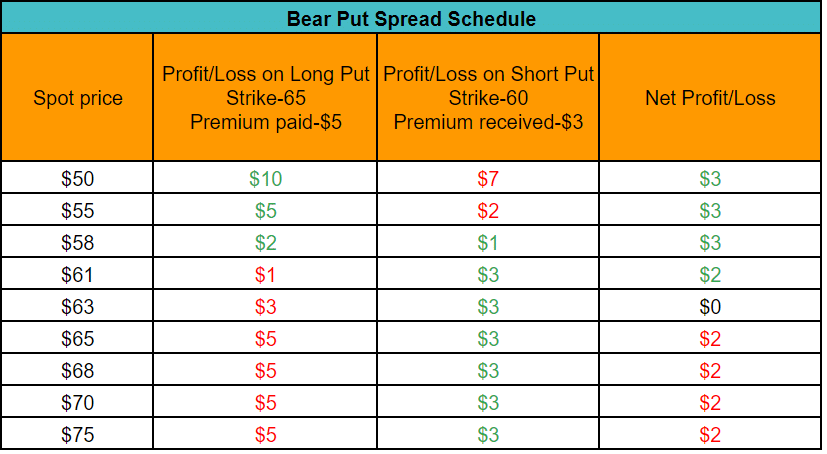
he bought 1 XYZ 65put at $5 and sold 1 XYZ 60put at $3.(1Lot =100 shares).
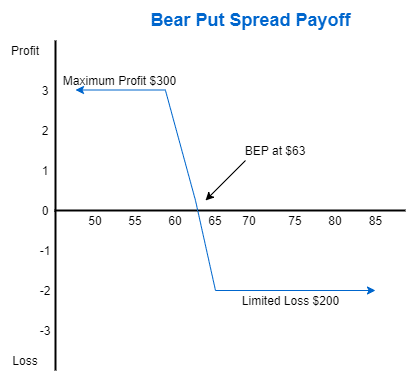
Maximum loss is limited to the net debit cost of the transaction. If the spot price falls below the short strike we will gain maximum profits.
Profit and Loss at different spot prices
Payoff Diagram
3. Iron Condor
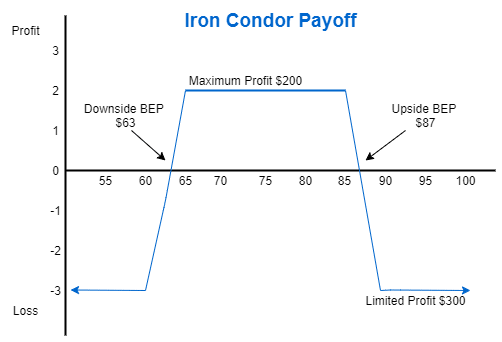
The iron condor is an advanced options strategy involving four options contracts. Each contract should have the same underlying asset and the expiration date. It is a combination of a bear call spread and a bull put spread. An iron condor is a neutral strategy where an investor expects the stock will remain in a particular range. This involves selling an out-of-the-money call and put, at the same time buying a further out-of-the-money call and put. There should be an equal width between the call spread and the put spread. Both profits and losses are limited in this strategy.
To implement iron condor-
Buy 1 OTM put (leg 1)
Sell 1 OTM put (leg 2)
Sell 1 OTM call (leg 3)
Buy 1 OTM call (leg 4)
Example
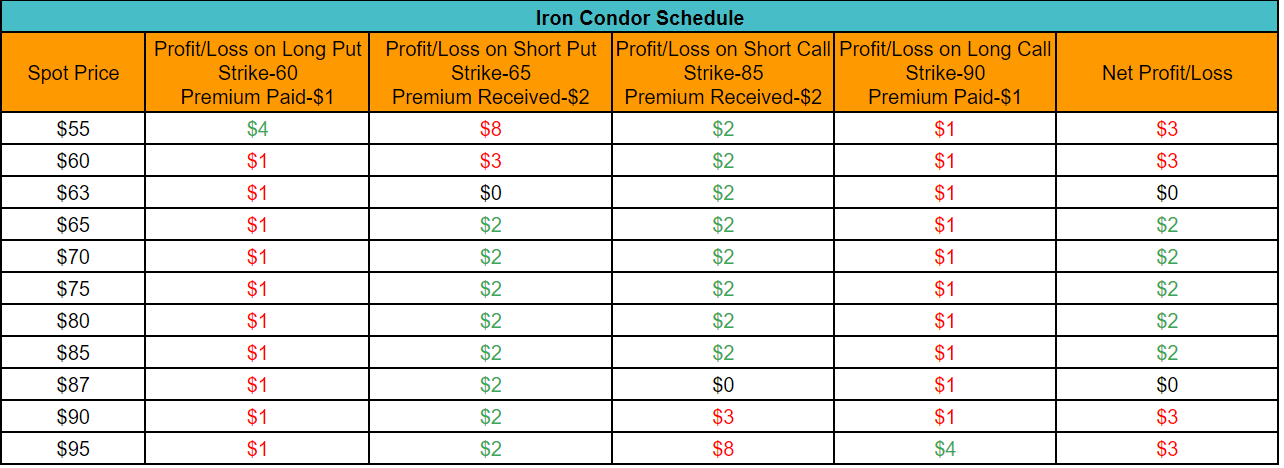
Currently, XYZ stock is trading at $75 investor expects the stock will remain in the range of $65-$85. He executed an iron condor by selling 65put at $2 and 85call at $2 at the same time he bought 60put at $1 and 90call at $1. If the price remains in the range of short strikes which is $65-$85, an investor will earn maximum profits. If the price goes out of this range he will suffer limited losses.
Profit and loss at different spot prices-
Key Metrics
- Spread = Difference between the strike of Short and Long Put/Call=$5 [(65-60) or (90-85)].
- Net Premium received= $200 (Premium received – Premium paid).
- Maximum Profit = Net Premium = $200.
- Maximum Loss = Spread – Net premium =$300 [(5-2)*100].
- Upside Break-even = Short Call Strike + Net Premium = $87.
- Downside Break-even = Short Put Strike – Net Premium = $63.
Payoff Diagram
4. Long Call Butterfly
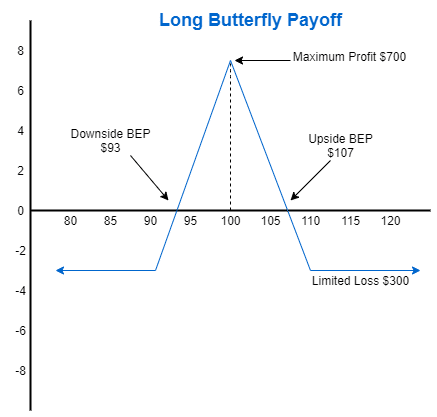
Long Call Butterfly is implemented when an investor is expecting very little or no movement in the underlying asset. A long call butterfly is the combination of a bull call spread and a bear call spread. It works best in the low volatile stocks. It involves buying one lower strike call, selling two higher strike calls, and buying one even higher strike call. All the options contracts should have the same underlying asset and the same expiration date. There should be equal width between the long strikes and the short strike.
To implement long call butterfly-
Buy 1 ITM call (leg1)
Sell 2 ATM calls (Leg 2)
Buy 1 OTM call (leg 3)
Example
Currently, XYZ is trading at $99 an investor expects the stock will move in the range of $90-$110. He bought a 90call(ITM) at $15, sold two 100calls(ATM) at $8 and bought a 110call(OTM) at $4 thus applied a long call butterfly strategy. The maximum risk equals the net debit cost of the transaction (Premium paid – premium received). Maximum profit is achieved when the stock closes at the short strike, in this case, $100.
Profit and Loss at different spot prices-
Key Metrics
- Spread = Difference between the strike of Short and Long call=$10 [(100-90) or (110-100)].
- Net Debit = $(15+4) – $(8*2) = $3*100 = $300.
- Maximum Loss = Net Debit = $300.
- Maximum Profit = Spread – Net Debit = $700 [(10-3) * 100)].
- Upside Break-even = Highest Strike – Net Debit =107 (110-3).
- Downside Break-even = Lowest Strike + Net Debit = 93 (90+3).
Payoff Diagram
5. Protective Collar
The Protective collar is also known as a hedge wrapper, is applied to protect the stock from the downside movement. A protective collar is a mixture of covered call and protective put which involves holding an underlying asset, buying a protective put, and selling a call. This is like buying insurance for the underlying asset to protect it from downside movement and financing it against selling a call. It limits the maximum risk and also capped the potential profit from the upside movement of the stock.
To implement the protective collar-
Hold a long position with at least 100 shares.
Buy 1 OTM put
Sell 1 OTM call
Example
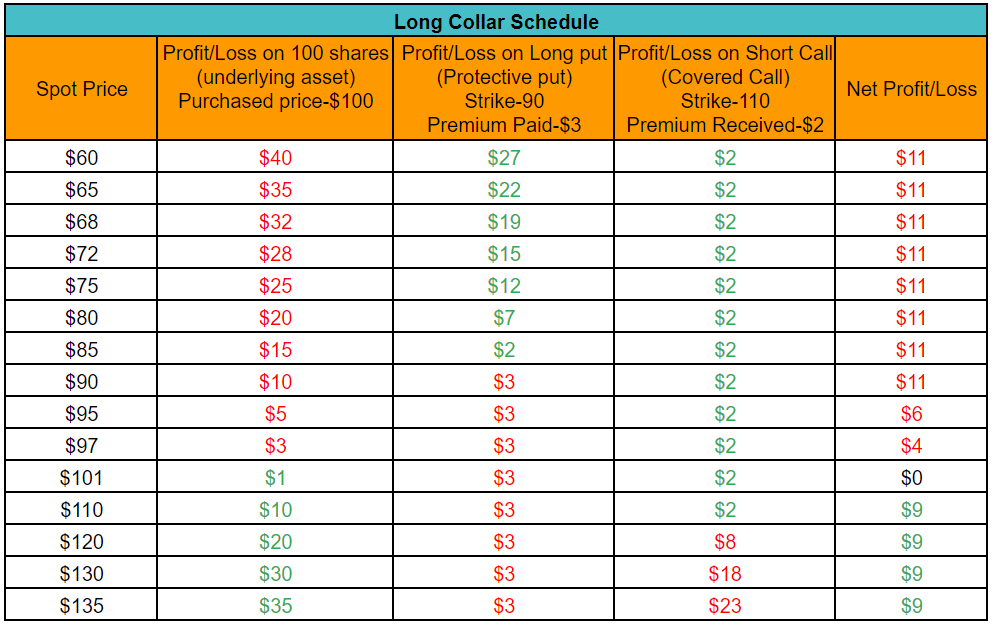
Suppose an investor is holding 100 XYZ shares purchased at $100 each. He has a bullish view of the stock and at the same time wants to protect it from downside movement. So he bought a 90put at $3. To offset this cost he sold a 110call at $2. The net cost incurred to execute this strategy is $100 [(3-2)*100].
Payoff Schedule
Key Metrics
- Net Debit Spread = premium paid – premium received = $100(300-200).
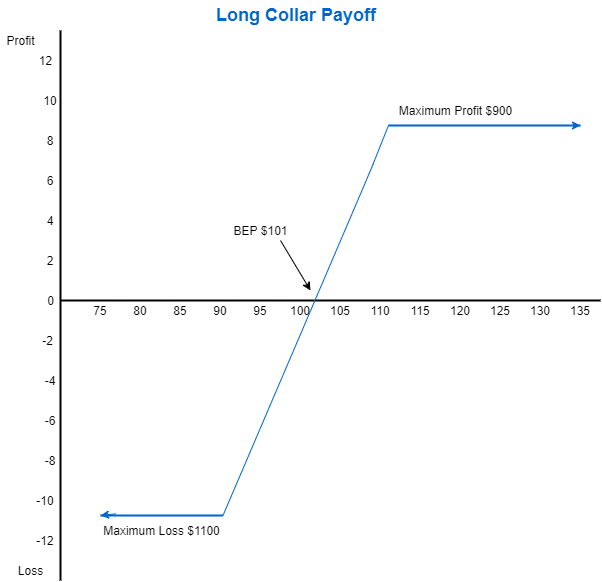
- Maximum Loss = Short call strike – purchased price of long shares+ Net Debit Spread=$11(110-100+1).
- Maximum Profit = Short call strike – purchased price of long shares-Net Debit Spread=$9(110-100-1)
- Break-even = Purchase price of long shares + Net Debit Spread (net premium paid).
Payoff Diagram
Conclusion
While working with these complex strategies it is advisable to trade in liquid options so that one can square off his position as soon as the spot price hits the target price. Liquid options give you the flexibility to enter or exit the trade. In this way, we can safeguard our profits and minimize our losses. Thus, while dealing in any options contract examine the stock’s option volume, open interest, bid/ask spread, etc.
Disclaimer
None of the content published on marketxls.com constitutes a recommendation that any particular security, portfolio of securities, transaction, or investment strategy is suitable for any specific person. The author is not offering any professional advice of any kind. The reader should consult a professional financial advisor to determine their suitability for any strategies discussed herein. The article is written for helping users collect the required information from various sources deemed to be an authority in their content. The trademarks if any are the property of their owners and no representations are made.
Reference
Learn more about options trading here
Learn more about options and various strategies here
Get Market data in Excel easy to use formulas
- Real-time Live Streaming Option Prices & Greeks in your Excel
- Historical (intraday) Options data in your Excel
- All US Stocks and Index options are included
- Real-time Option Order Flow
- Real-time prices and data on underlying stocks and indices
- Works on Windows, MAC or even online
- Implement MarketXLS formulas in your Excel sheets and make them come alive
- Save hours of time, streamline your option trading workflows
- Easy to use with formulas and pre-made templates

I invite you to book a demo with me or my team to save time, enhance your investment research, and streamline your workflows.
