

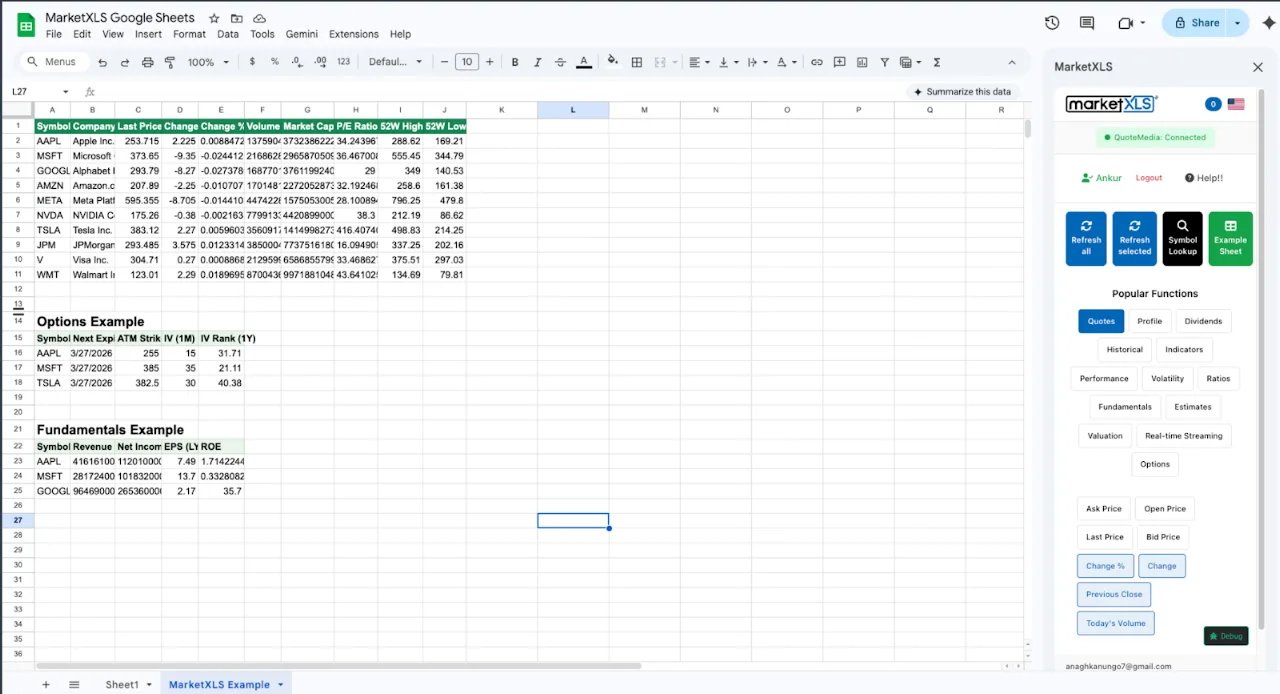
Google Sheets' built-in GOOGLEFINANCE function cannot return option chain data: it has no attribute for option contracts, strikes, bid/ask, open interest, implied volatility, or Greeks. To get an option chain into Google Sheets, install the MarketXLS Google Sheets add-on and use =QM_GetOptionChain("AAPL"), which returns the chain for an underlying into the sheet. The same function works in Excel with the MarketXLS add-in. Options data is end-of-day on the Standard plan and real-time streaming on the Advanced and Business plans (pricing).
This guide lists what GOOGLEFINANCE covers and where it stops, then walks through an options workbook built with MarketXLS formulas. The two downloadable templates below are Excel files: a static Sample to see the layout, and a Template with live MarketXLS formulas.
What GOOGLEFINANCE Actually Does Well
GOOGLEFINANCE is the built-in Google Sheets function that returns market data for a stock, ETF, mutual fund, or currency. The syntax:
=GOOGLEFINANCE(ticker, [attribute], [start_date], [end_date|num_days], [interval])
For equity-level data, it covers most of the everyday questions a self-directed investor or financial advisor would have. Here is a quick reference for the attributes that work today:
| Attribute | Returns | Example |
|---|---|---|
"price" | Last price (may be delayed up to 20 minutes) | =GOOGLEFINANCE("AAPL","price") |
"priceopen" | Opening price for the day | =GOOGLEFINANCE("AAPL","priceopen") |
"high" / "low" | Intraday high/low | =GOOGLEFINANCE("AAPL","high") |
"volume" | Current day volume | =GOOGLEFINANCE("AAPL","volume") |
"marketcap" | Market capitalization | =GOOGLEFINANCE("AAPL","marketcap") |
"beta" | Beta vs market | =GOOGLEFINANCE("AAPL","beta") |
"pe" | Price-to-earnings ratio | =GOOGLEFINANCE("AAPL","pe") |
"eps" | Trailing 12-month EPS | =GOOGLEFINANCE("AAPL","eps") |
"high52" / "low52" | 52-week high/low | =GOOGLEFINANCE("AAPL","high52") |
"change" / "changepct" | Daily change | =GOOGLEFINANCE("AAPL","change") |
"close" (historical) | Close for a date range | =GOOGLEFINANCE("AAPL","close",DATE(2025,1,1),DATE(2026,1,1),"DAILY") |
For equity tracking and basic dashboards, these attributes are enough: you can build a watchlist, pull price and volume, calculate daily change, and chart historical closes without an API key.
Where GOOGLEFINANCE Stops
GOOGLEFINANCE has no attribute for any options data. It does not return:
- Live option last price for a specific contract
- Bid and ask quotes per contract
- The full option chain (all strikes and expirations for an underlying)
- Filtered chains (at-the-money, in-the-money, out-of-the-money, weeklies, monthlies)
- Open interest and volume per strike
- Implied volatility for either the underlying or a specific contract
- IV rank or IV percentile over the last year
- Delta, Gamma, Theta, Vega, Rho
- Theoretical option pricing (Black-Scholes value)
- Historical option chains for backtesting
- Streaming option quotes during market hours
The function was built for equity quotes and a small set of fundamental fields, not multi-row option chains. If you try =GOOGLEFINANCE("AAPL250620C00200000","price") with an OCC-formatted option symbol, Google Sheets will return #N/A.
There are two ways to get option data into Google Sheets:
- Write Google Apps Script that calls a licensed market data API. This requires JavaScript, an API key, and your own refresh logic.
- Install a Google Sheets add-on that provides options data, such as the MarketXLS add-on, which adds formulas like
=QM_GetOptionChain("AAPL").
If you only need equity prices in Google Sheets, GOOGLEFINANCE is enough.
A Quick Capability Matrix
This matrix compares GOOGLEFINANCE with the MarketXLS Excel add-in. The MarketXLS Google Sheets add-on also returns option chains and Greeks; check individual function availability for Sheets on the formulas page.
| Capability | GOOGLEFINANCE (Google Sheets) | MarketXLS (Excel) |
|---|---|---|
| Live equity price | Yes | Yes |
| Daily change and percent | Yes | Yes |
| Volume and market cap | Yes | Yes |
| Beta, P/E, EPS | Yes | Yes |
| 52-week high/low | Yes | Yes |
| Historical equity prices | Yes | Yes |
| Live option last price | No | Yes |
| Bid/ask per contract | No | Yes |
| Full option chain (spill) | No | Yes |
| Filtered chain (ATM/ITM/OTM/weekly/monthly) | No | Yes |
| Open interest and volume per strike | No | Yes |
| Implied volatility (underlying and contract) | No | Yes |
| IV rank and IV percentile | No | Yes |
| Delta, Gamma, Theta, Vega | No | Yes |
| Black-Scholes theoretical value | No | Yes |
| Historical option chain | No | Yes |
| Streaming option prices | No | Yes (Excel desktop, Advanced or Business plan) |
If your workflow is purely equity, GOOGLEFINANCE is fine. For options work (tracking IV rank, scanning chains for cash-secured put candidates, or modelling Greeks for a multi-leg position) you need an options data source such as MarketXLS.
The MarketXLS Approach: Bring the Chain Into the Cell
MarketXLS works like GOOGLEFINANCE: you type a formula and get a value. The difference is coverage. MarketXLS adds options, fundamentals, and technical indicator functions, as an Excel add-in and as a Google Sheets add-on. Quotes come from QuoteMedia.
For the live option chain specifically, the headline functions are:
=QM_GetOptionChainActive("AAPL")- returns the most actively traded options across the chain, spilled into the worksheet=QM_GetOptionChain("AAPL")- returns the full chain (all strikes, all expirations)=QM_GetOptionChainAtTheMoney("AAPL")- only ATM contracts=QM_GetOptionChainInTheMoney("AAPL")- only ITM contracts=QM_GetOptionChainOutOfTheMoney("AAPL")- only OTM contracts=QM_GetOptionChainNearTerm("AAPL")- only the nearest expiration=QM_GetOptionChainWeeklies("AAPL")- only weekly expirations=QM_GetOptionChainMonthlies("AAPL")- only monthly expirations=QM_GetOptionChainQuarterlies("AAPL")- only quarterly/LEAPS expirations=QM_GetOptionQuotesAndGreeks("AAPL")- chain plus Delta, Gamma, Theta, Vega, Rho
Each of these spills into the worksheet the same way an array formula does in modern Excel. You type one formula, you get rows of contracts back.
Around the chain itself, the underlying-level functions complete the picture:
=QM_Last("AAPL")- last equity price (this is theGOOGLEFINANCE("AAPL","price")equivalent)=ImpliedVolatility("AAPL")- 30-day at-the-money implied volatility=ImpliedVolatilityRank1y("AAPL")- IV rank over the last year=ImpliedVolatilityPct1y("AAPL")- IV percentile over the last year=IsOptionable("AAPL")- returns Yes if listed options exist=opt_PutCallVolRatio("AAPL")- sentiment via put/call volume ratio=opt_PutCallOIRatio("AAPL")- put/call open interest ratio=Beta("AAPL")- beta vs market=Sector("AAPL")and=Industry("AAPL")- classification
For individual contracts, you first build a contract symbol with OptionSymbol, then feed it to the on-demand or streaming functions:
=OptionSymbol("AAPL", "2026-06-20", "Call", 200)
=QM_Last(OptionSymbol("AAPL","2026-06-20","Call",200))
=opt_Delta(QM_Last("AAPL"), QM_Last(OptionSymbol(...)), "2026-06-20", "Call", 200)
=opt_Gamma(QM_Last("AAPL"), QM_Last(OptionSymbol(...)), "2026-06-20", "Call", 200)
=opt_Theta(QM_Last("AAPL"), QM_Last(OptionSymbol(...)), "2026-06-20", "Call", 200)
=opt_Vega(QM_Last("AAPL"), QM_Last(OptionSymbol(...)), "2026-06-20", "Call", 200)
=BlackScholesOptionValue(OptionSymbol(...), 200, 18, 0.04, 0.262, "Call")
Formula documentation: OptionSymbol, QM_Last, opt_Delta, opt_Gamma, opt_Theta, opt_Vega, BlackScholesOptionValue
None of these contract-level values are available from GOOGLEFINANCE.
Building an Options Workbook Step by Step
The template attached at the bottom of this post follows five steps, from screening underlyings to pricing a specific contract.
Step 1: Underlying Dashboard
Start with a watchlist of tickers you actually trade. For each one, pull the underlying-level fields. The point of this sheet is to filter the universe down to a few names where the options environment is interesting.
A: Ticker
B: =QM_Last(A2)                       'Last price (GOOGLEFINANCE equivalent)
C: =ImpliedVolatility(A2)             '30-day IV
D: =ImpliedVolatilityRank1y(A2)       'IV rank over the last year
E: =IsOptionable(A2)                  'Sanity check
F: =Beta(A2)                          'Vol vs market
G: =Sector(A2)                        'Classification
H: =DividendYield(A2)                 'Income tilt
I: =IF(D2>=$B$4,"Sell premium candidate",
       IF(D2>=20,"Watch","Buy options or skip"))
Formula documentation: QM_Last, ImpliedVolatility, ImpliedVolatilityRank1y, IsOptionable, Beta, Sector, DividendYield
The IF formula uses an input cell, $B$4, where you set the IV rank threshold for selling premium. This is the kind of "input-cell driven dashboard" that the workbook is built around.
Step 2: Live Option Chain
Once you have a name on the watchlist worth a closer look, switch to the chain. The MarketXLS approach is one cell, one spill:
B3: AAPL                              'Underlying input (yellow cell)
A10: =QM_GetOptionChainActive(B3)     'Active strikes spill below
Formula documentation: QM_GetOptionChainActive
When the add-in pulls, you get a block of rows with: underlying, expiration, type (call/put), strike, bid, ask, last, volume, open interest, implied volatility for each contract. Want only at-the-money? Swap to QM_GetOptionChainAtTheMoney(B3). Want the nearest expiration? Use QM_GetOptionChainNearTerm(B3). Want only weeklies because you sell short-dated premium? Use QM_GetOptionChainWeeklies(B3).
No GOOGLEFINANCE attribute returns this data. In Google Sheets, you need an options add-on such as MarketXLS or your own Apps Script connection to a licensed API.
Step 3: Greeks Worksheet
For any contract you actually consider, you want Greeks. The opt_ family handles single-contract calculations and the QM_GetOptionQuotesAndGreeks function returns the entire chain with Greeks attached.
A: Ticker      B: Expiration   C: Type   D: Strike
E: =QM_Last(A5)
F: =QM_Last(OptionSymbol(A5,B5,C5,D5))
G: =opt_Delta(E5,F5,B5,C5,D5)
H: =opt_Gamma(E5,F5,B5,C5,D5)
I: =opt_Theta(E5,F5,B5,C5,D5)
J: =opt_Vega(E5,F5,B5,C5,D5)
K: =BlackScholesOptionValue(OptionSymbol(A5,B5,C5,D5), D5, 18, $B$2, ImpliedVolatility(A5), C5)
Formula documentation: QM_Last, OptionSymbol, opt_Delta, opt_Gamma, opt_Theta, opt_Vega, BlackScholesOptionValue, ImpliedVolatility
$B$2 is a yellow input cell with the risk-free rate (the workbook ships with 0.04 as a starting point). Edit it and the Black-Scholes values across the worksheet recompute.
Step 4: Strategy Builder
The Strategy Builder sheet uses QM_Last on both the underlying and the option symbol to compute the premium received as a percentage of either the stock price or the strike price. That gives you the static yield of a covered call or a cash-secured put for any contract.
'Covered Call: AAPL 205 strike, expiring 2026-06-20
Stock Last:       =QM_Last("AAPL")
Option Last:      =QM_Last(OptionSymbol("AAPL","2026-06-20","Call",205))
Premium %:        =OptionLast / StockLast
Static Yield:     =OptionLast / Strike
Forward Div Yield:=ForwardAnnualDividendYield("AAPL")
Formula documentation: QM_Last, OptionSymbol, ForwardAnnualDividendYield
The point is not that the strategy will be profitable. The point is that you can sit in a spreadsheet, change the strike, change the expiration, change the ticker, and see the premium math update without ever leaving Excel.
Step 5: Google Sheets vs MarketXLS Reference
The last sheet in the workbook is a side-by-side capability matrix. For every common task, it shows what the Google Sheets GOOGLEFINANCE formula would look like (where one exists), what the MarketXLS equivalent is, and which platform wins. This is the sheet to show a teammate when they ask "why are we not just doing this in Google Sheets?"
Google Sheets add-on or Excel add-in for options?
Use the MarketXLS Google Sheets add-on if your workflow lives in Google Sheets and you need option chains, IV, and Greeks for research. Use the Excel add-in on Windows if you need tick-by-tick streaming during market hours: the streaming QM_Stream_* functions update cells automatically in Excel desktop. Google Sheets add-ons recalculate on Google's schedule rather than streaming each tick. Both use the same MarketXLS pricing.
Common MarketXLS Option-Chain Formulas, Verified
The formulas below are the main MarketXLS option-chain and options analytics functions. Check platform availability for each on the formulas page.
| Formula | Returns |
|---|---|
=QM_Last("AAPL") | Last traded equity price |
=Beta("AAPL") | Beta vs market |
=ImpliedVolatility("AAPL") | 30-day IV |
=ImpliedVolatilityRank1y("AAPL") | 1-year IV rank |
=ImpliedVolatilityPct1y("AAPL") | 1-year IV percentile |
=IsOptionable("AAPL") | Yes if listed options exist |
=opt_PutCallVolRatio("AAPL") | P/C volume ratio |
=opt_PutCallOIRatio("AAPL") | P/C open interest ratio |
=Sector("AAPL") | Sector |
=DividendYield("AAPL") | Trailing dividend yield |
=ForwardAnnualDividendYield("AAPL") | Forward dividend yield |
=QM_GetOptionChain("AAPL") | Full chain (spill) |
=QM_GetOptionChainActive("AAPL") | Active strikes (spill) |
=QM_GetOptionChainAtTheMoney("AAPL") | ATM contracts only |
=QM_GetOptionChainInTheMoney("AAPL") | ITM contracts only |
=QM_GetOptionChainOutOfTheMoney("AAPL") | OTM contracts only |
=QM_GetOptionChainNearTerm("AAPL") | Nearest expiration only |
=QM_GetOptionChainWeeklies("AAPL") | Weeklies only |
=QM_GetOptionChainMonthlies("AAPL") | Monthlies only |
=QM_GetOptionChainQuarterlies("AAPL") | Quarterlies / LEAPS |
=QM_GetOptionQuotesAndGreeks("AAPL") | Chain with Greeks |
=QM_GetOptionMarketStats("AAPL") | Aggregate option stats |
=QM_GetRecentOptionStats("AAPL") | Recent option activity |
=OptionSymbol("AAPL","2026-06-20","Call",200) | OCC option symbol |
=QM_Last(OptionSymbol(...)) | Option last price |
=QM_Bid(OptionSymbol(...)) | Option bid |
=QM_Ask(OptionSymbol(...)) | Option ask |
=QM_OpenInterest(OptionSymbol(...)) | Open interest |
=opt_Delta(Stock,Opt,Expiry,Type,Strike) | Delta |
=opt_Gamma(Stock,Opt,Expiry,Type,Strike) | Gamma |
=opt_Theta(Stock,Opt,Expiry,Type,Strike) | Theta |
=opt_Vega(Stock,Opt,Expiry,Type,Strike) | Vega |
=BlackScholesOptionValue(Symbol,Strike,Days,Rate,Vol,CallPut) | Theoretical value |
Each formula takes a ticker (or an option symbol) from a cell, so one input cell can drive a whole workbook.
Download the Templates
Both files use the same six-sheet layout: How To Use, Underlying Dashboard, Live Option Chain, Greeks, Strategy Builder, and a Google Sheets vs MarketXLS reference matrix. The Sample is filled with snapshot values so you can see the layout without an add-in. The Template uses live MarketXLS formulas that refresh in Excel desktop.
Download the templates:
- - Pre-filled with snapshot values
- - Live-updating formulas
The Sample workbook is useful even without MarketXLS: the "Formula Reference" columns in each sheet show the exact function behind every value.
Frequently Asked Questions
Can GOOGLEFINANCE return an option chain?
No. The GOOGLEFINANCE function covers equity quotes, basic fundamentals, and historical prices, but it has no attribute that returns an option chain, an individual option contract price, or Greeks. If you pass an option symbol, it returns #N/A. For option chains in a spreadsheet, use an add-on such as MarketXLS (available for Google Sheets and Excel) or call a licensed API from Google Apps Script.
What is the equivalent of GOOGLEFINANCE("AAPL","price") in MarketXLS?
The direct equivalent is =QM_Last("AAPL"). Both return the last traded price for the stock. The MarketXLS function uses QuoteMedia data; on the Standard plan US stock quotes are 15-minute delayed.
How do I pull live option prices into Google Sheets specifically?
Install the MarketXLS Google Sheets add-on and use =QM_GetOptionChain("AAPL") for the chain, or =QM_Last(OptionSymbol("AAPL","2026-06-20","Call",200)) for one contract. GOOGLEFINANCE alone cannot do this. The other route is a Google Apps Script wrapper around a licensed market data API.
What is IV rank and why does it matter?
IV rank is a measure of where current implied volatility sits relative to the past year's range. A reading near 100 means IV is at or near its 12-month high, which generally favours premium-selling strategies (covered calls, cash-secured puts, credit spreads). A reading near 0 means IV is at or near its 12-month low, which generally favours premium-buying strategies (long calls, long puts, debit spreads). MarketXLS exposes IV rank via =ImpliedVolatilityRank1y("AAPL"). Google Sheets has no equivalent.
Does the MarketXLS option chain stream in real time?
Streaming requires Excel desktop and a plan with real-time options data (Advanced or Business; Standard is end-of-day). On-demand functions like QM_Last and QM_GetOptionChainActive return a snapshot that updates when you press F9 or use the MarketXLS refresh button, while QM_Stream_* functions update automatically while streaming is on. Options tracking is limited to 300 symbols.
Can I backtest options strategies in the same workbook?
You can pull historical option chains using OPT_HistoricalOptionChain and historical Greeks via opt_DeltaHistorical, opt_GammaHistorical, and similar functions. These let you reconstruct what the chain looked like on a specific past date, which is what most casual backtests need. Google Sheets cannot do this at all.
The Bottom Line
GOOGLEFINANCE handles equity prices, basic fundamentals, and historical closes in Google Sheets, but it stops at the equity quote: no option chain, Greeks, implied volatility, or contract-level bid/ask.
To keep options work in Google Sheets, add the MarketXLS Google Sheets add-on. If you need tick-by-tick streaming, use the MarketXLS Excel add-in on Windows. Equity-only tracking can stay on GOOGLEFINANCE.
The downloadable templates above show the exact layout we use internally. Open the Sample first to see the structure, then connect MarketXLS in Excel and open the Template to see the live formulas in action.
Learn more about MarketXLS at marketxls.com, or book a demo to see the option chain functions live in your own workbook.
This article is educational and not investment advice. Always verify option data and pricing in your broker before placing any trade.
